

When Exactly Does A Stock Become A Bargain?
Many of the stocks that ran in 2026 and 2025 have in the past several weeks gone on to hit their stops. That is assuming you were in the habit of placing stops. But that habit is only developed over time and with discipline, with a set number of rules of trading. The need to believe that we are smart, smarter than the market or other market participants is a stock account killer. Unfortunately, for many that lesson is learned too late, well after the stock trading account has been killed by the market.
Decision-making skills are critical in surviving the tricks and the whipsaws of the market. In order to practice making the right decision at each and every turn of a stock along its journey, let us suppose that you are of the mind that there are bargains in the market. Further, let us suppose that a bargain is only determined when a high-priced stock falls in price. That is the way our mind has been programmed all our lives. After all, who doesn’t like a sale? When we see a sale or a discount, we all face the decision whether the sale price offered or the discount is good enough to consider such a sale to be a good deal? This is America. There is sale every second of the day, 365 days a year, each and every year. Why should the stock market be any different?
As an example, let us use the chart below as an exercise to practice some decision-making in real time. In order to best understand yourself, you have to find a way to be in-the-moment. To be present. And not to look to predict or anticipate. To be successful at this stock market stuff, this is key skill to develop. Be present. Be in-the-moment. Which means, place yourself at price/time of the final arrow of the chart for each chart. And see if you can discipline yourself to not peek into the next chart until you have decided what you will do at the spot where the final arrow of the current chart is. Let us start start with Chart#1 below.
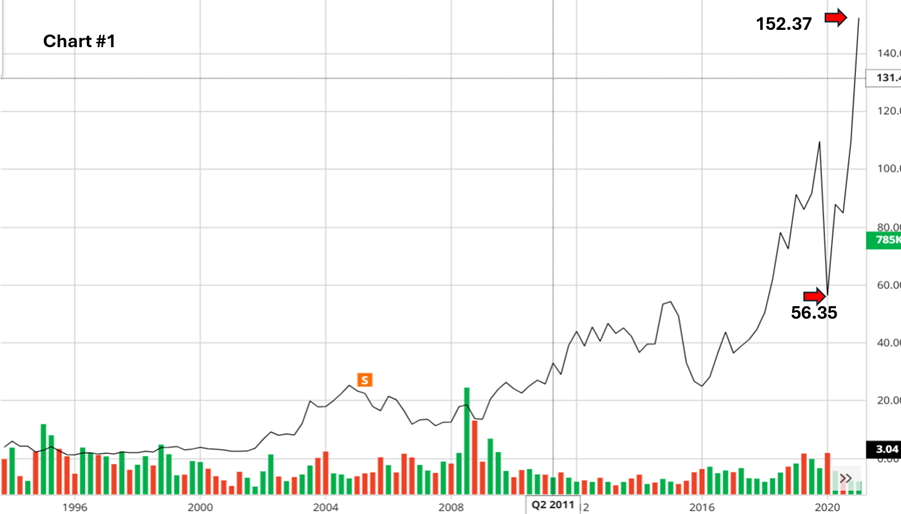
This a slow long climb with a lot of gyration and in reality would have been a hard stock to ride with on the way up. Pretend you are driving along this line through its various ups and downs. You notice that the drive from the price-point of $56.35 to the price point of $152.37 is sudden and quick. It was basically from early 2020 to early 2021. Like many stocks during that phase, from just after the March 2020 Covid Panic. Keep in mind that not all observations and interpretations are actionable. In fact, the vast majority of the time most observations and interpretations are not actionable. The trick is know when to hold your fire and when to release the torpedo. Now let us take a look at the next chart, Chart #2, as shown below.
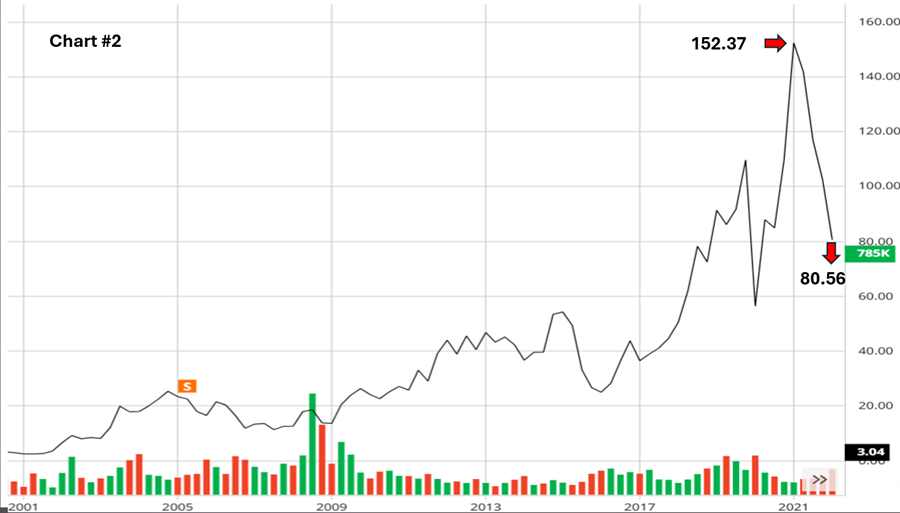
Remember, we are seeking a bargain. A bargain, a sale, a discount has been programmed into our minds for all our lives. Something that was at a high price has been slashed down to a lower price. This stock fell from $152.37 to $80.56 quickly. If you had continued driving along the line, the climb up the hill to $152.37 was steep and then the sudden descent from $152.37 to the current price point of $80.56 was just as steep, and just as quick. Is this a bargain at $80.56? It is only a bargain because you have previously seen a higher price at $152.37. Suppose you have zero knowledge of charts. And imagine this to be not a stock, instead you are told that your most favorite thing in the world has been reduced in price from $152.37 to $80.56, would you be tempted to buy it? Now let us take a look at the next chart, Chart #3.
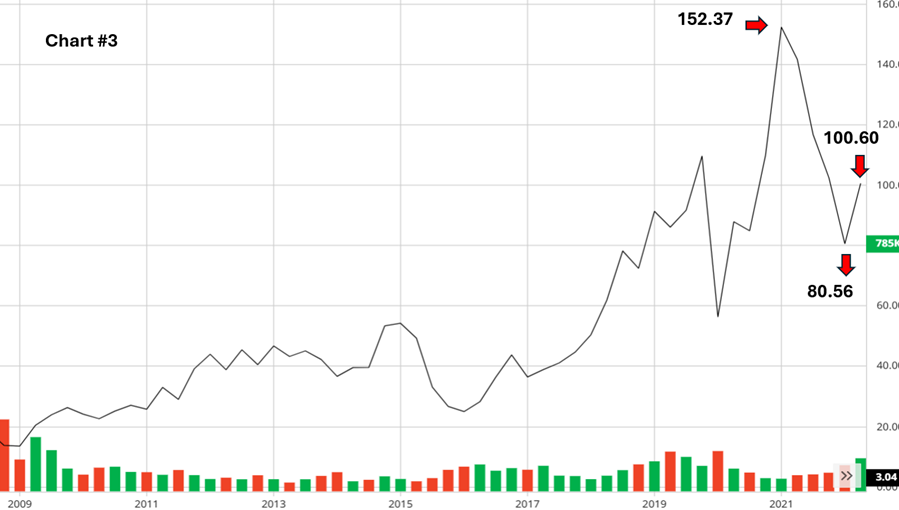
Continue your drive along the line of the chart. After the prior descent to $80.56, now there a climb from $80.56 to $100.60. What is your minding telling at this price-point? The bargain is vanishing and that you should grab it before the price rises further? Or do you have some modicum of discipline and some non-negotiable rules in place? While you are driving up and down, do you have the non-negotiable rule of using your seatbelt? Do you operate with any other non-negotiable rules? Let us now look at Chart #4.
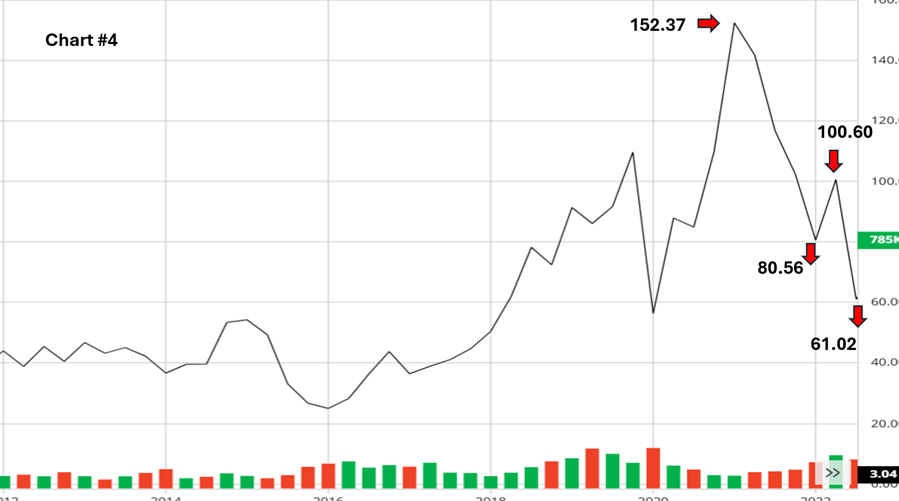
Clearly if you were somewhat well-versed with charts, you see a downtrend in effect for this stock. However, for our exercise assume that you have zero knowledge of the stock market. Truth be told, everyone has zero knowledge of the stock market, no matter how experienced. But very few acknowledge it and understand it to be true. How is your drive along this line of the chart going? What is your mind saying now? Has the bug that is in your ear, implanted by decades of programming, stopped muttering that this is a bargain? Or does it chirp louder that this is a bigger bargain? How is your decision-making going? Are you going to decide to buy this stock thinking this is surely a bargain now at $61.02 compared to its high at $152.37. Or is your mind saying this is actually a short-seller’s dream? Would you act on any of your observations? If so, where is the stop to protect yourself from yourself? Now, let us look at Chart #5.
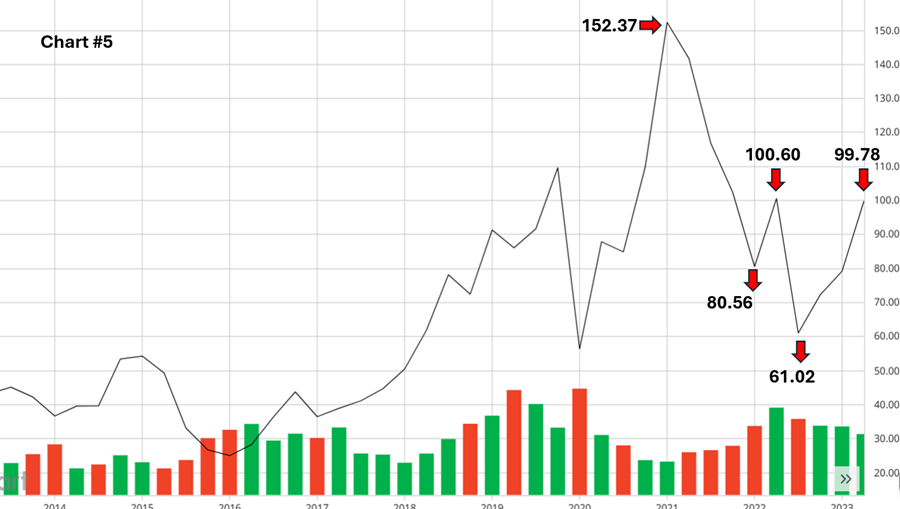
Now your drive along the line of the chart brings you back almost to the prior height of $100.60 but not quite. Almost there, but not quite. $99.78 is where you come to but not to $100.60. What is the chart saying to you now when you are at $99.78? Did the bargain at $61.02 vanish? Did you miss buying at a low? Has the stock turned itself around? Is there anything to be garnered from the volume part of the chart? Now let us look at Chart #6.
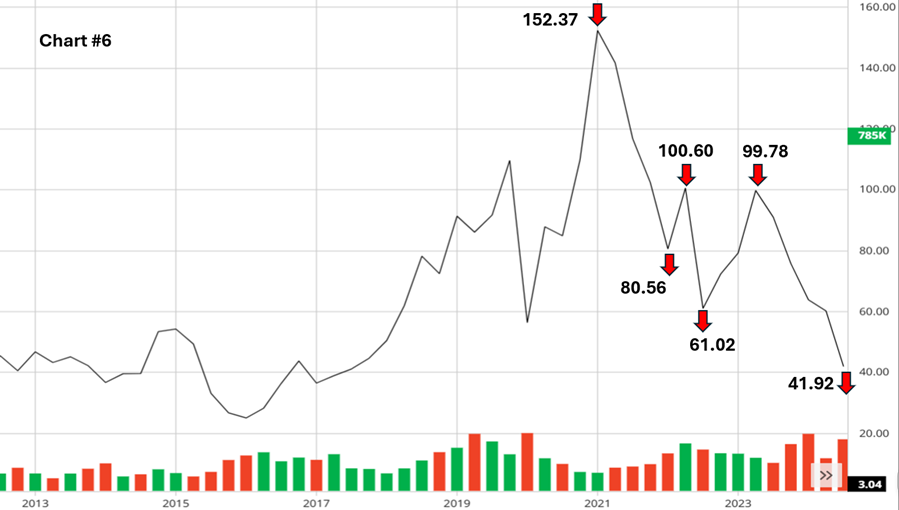
Well, that was yet another really steep descent. Your eyes must be feasting at all the scenery with these huge and steep descents and ascents. Did you bring your camera? This must be your lucky day; this must surely be a bargain now. Isn’t this what the Wall Street machinery tells you? A stock that was $152.37 is now at $41.92. What a deal! What a sale! What a discount! When the stock comes back to $152.37 you would have almost quadrupled your money. What is your mind saying? What decision will you make here at the present price-point of $41.92? Now, let us take a look at Chart #7.
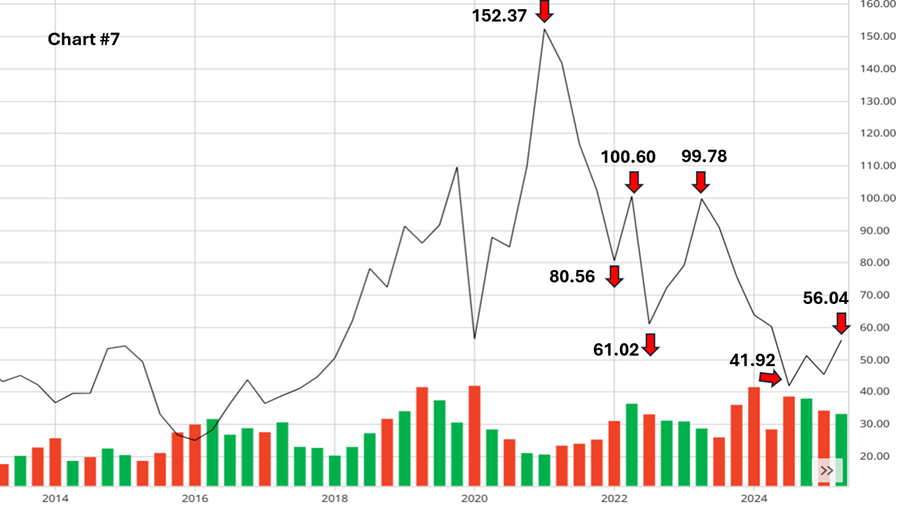
A small bounce back, from $41.92 to $56.04. Is your mind now saying that the descent seems to be almost over and that you seem to be flattening out, and perhaps you have reached the bottom? But suppose all these gyrations, driving down, and driving back up and then down further again and so on has caused some uneasiness in your stomach. And you decide that this is not a game for the novice. Which may be one of the better decisions to make. And that you will sit tight and see what develops. What do you think happens next? Let us now take a look at the final chart for this stock, Chart #8. And let us also disclose the stock that these charts belong to.
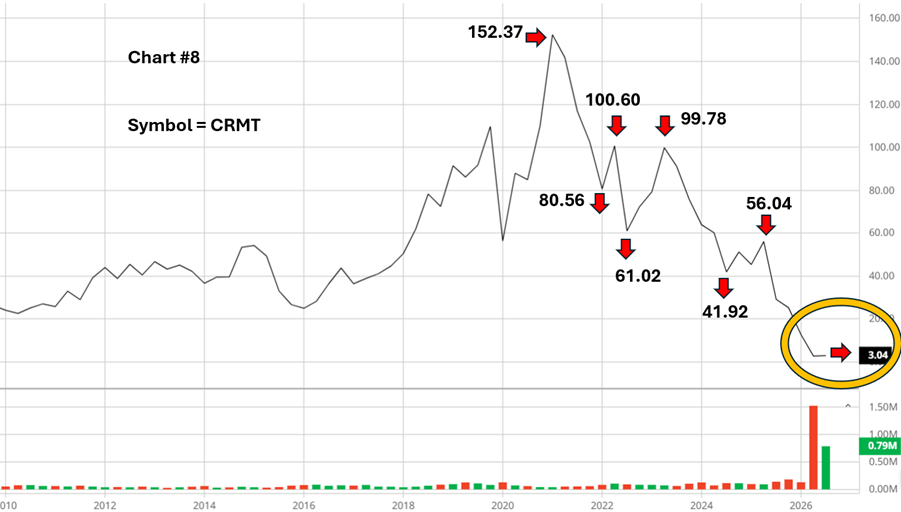
I did not want to bore you with any additional driving but suffice to say the last descent was rather straight down and severe, all the way to this week’s close at $3.04. Surely, it must be a bargain now? What do you think? Does the sudden volume tell you something? I have circled the recent past in yellow just to let you zoom in on this chart for CRMT (America’s Car-Mart) on your own. Is this now a bargain? Is it actionable? What will make it actionable?
Do you have what it takes to keep at charts daily? Day after day, week after week, year after year, for the rest of your life? We are all fools, some of use more foolish than others. It is highly recommended to be more foolish than more smart when dealing with the market. Want more practice? Take a look at these two charts. The beginning chart and a latest current zoomed-in chart.
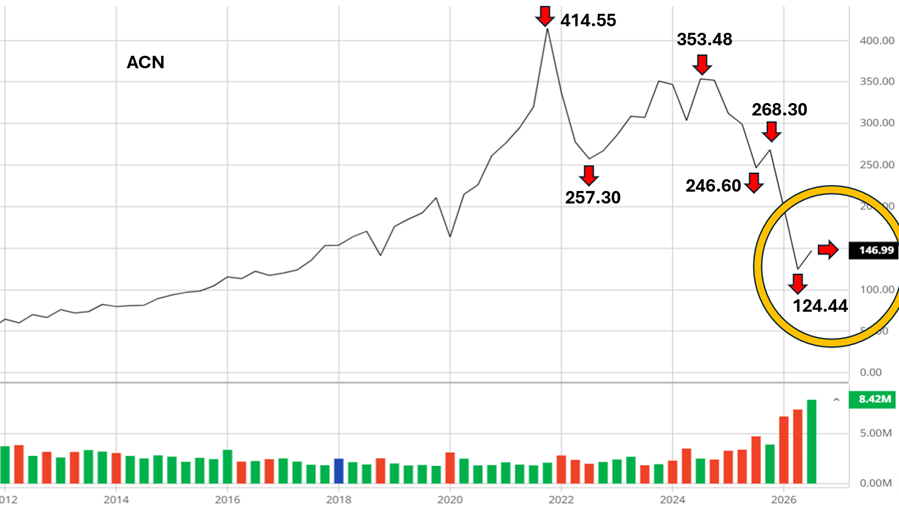
Everything has been disclosed. This is a chart for ACN (Accenture). Does the circled part indicate something? Below is the zoomed-in part of the circled section.
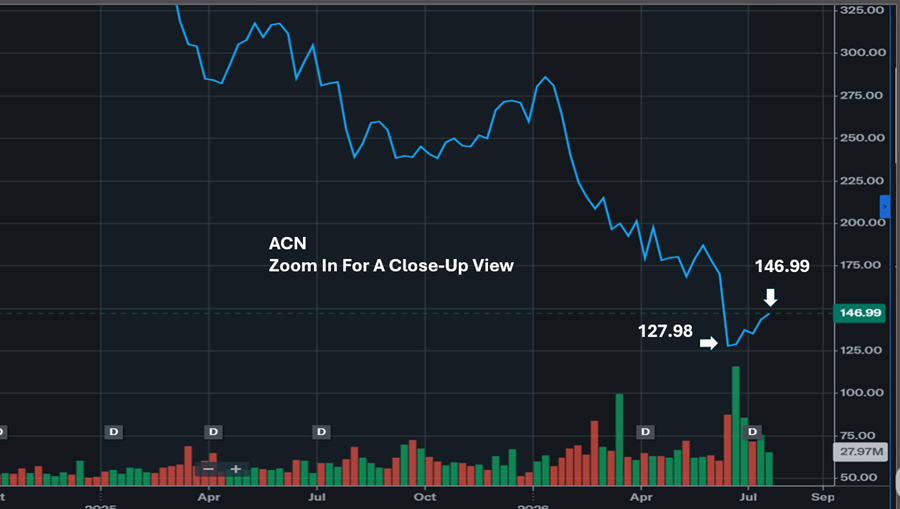
You can do your own check. Is anything actionable? If so, what would the action be? Just realize that no one knows if this is actionable. The stock will inform you in due time if the action was right or not, assuming you have the right stops in place.

 English
  Spanish