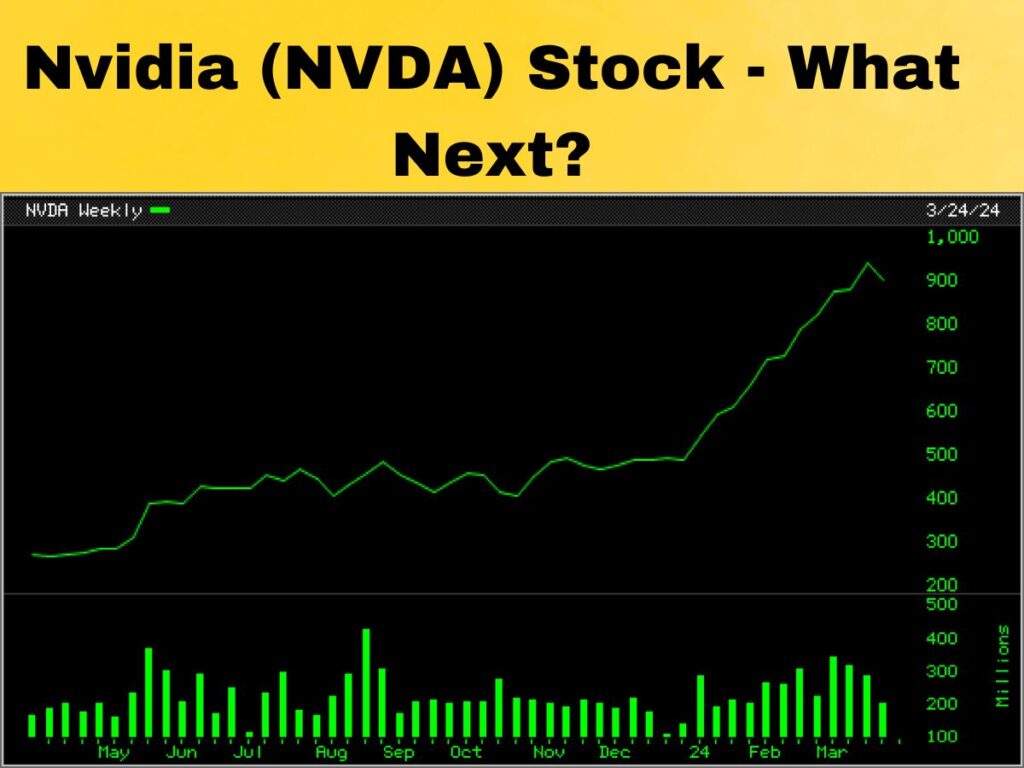
After eleven straight weeks of price gain, Nvidia (NVDA) stock finally had a down week. Those who are trend followers or trend traders have been waiting for a reaction to its recent price gains. But is this the beginning of a reaction?
If your approach is to observe Nvidia (NVDA) stock chart for clues, then you have been waiting for the past eleven weeks for some sort of price reaction. Finally, this past week showed the first down week in 2024. What does this mean? What have stocks that have run up for weeks on end typically done in the past? Suppose you went back to 2019 and took a look at Tesla (TSLA) stock chart.
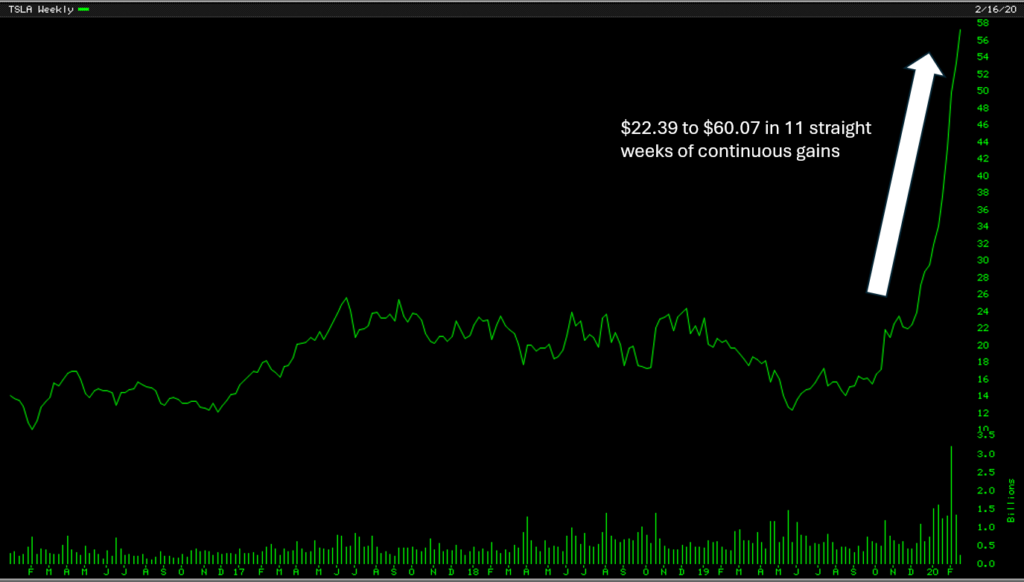
What Does Tesla (TSLA) Stock Breakout Say About Fast Prior Uptrends?
Stocks tend to do what they want to do. No amount of anticipation or prediction works. If one looked at Tesla (TSLA) stock breakout back in 2019, it ran away from a price of $22.39 to $60.07 in twelve weeks without a reaction. For the normal human mind that would signal a stock that has run up too high too fast. Such returns are unrealistic. Almost an 800% return on an annualized basis. “Impossible!” would be the first thing that would come to one’s mind. What do you think happened next with Tesla (TSLA)?
That was an impressive move up as well. Until it encountered the same shock that all stocks encountered due to Covid-19 panic in March 2020. The reaction came, swiftly and deep. In a matter of weeks, Tesla (TSLA) fell from a stock price of $60.07 to $28.50 per share. Giving up almost all of its recent gains.
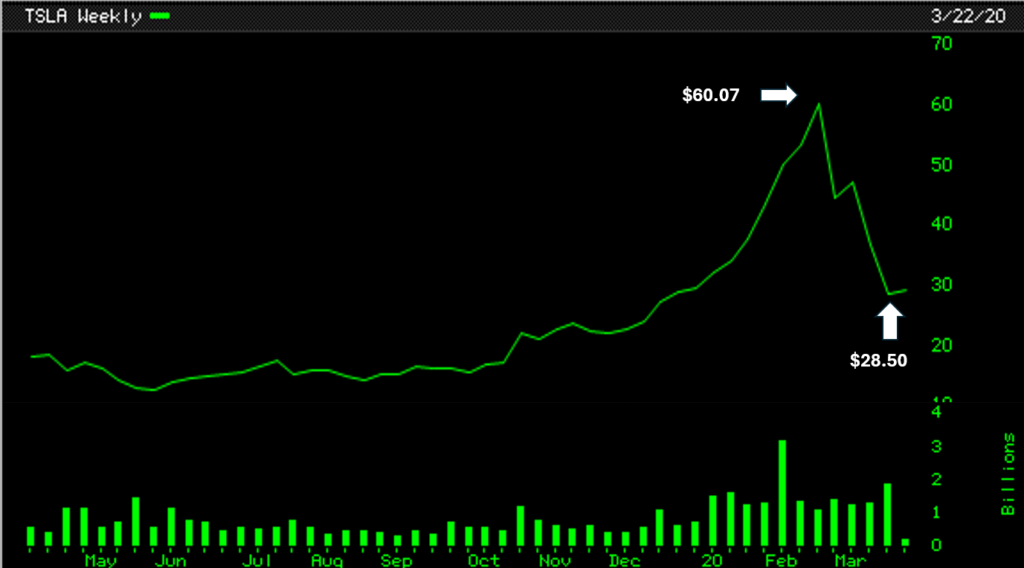
As the panic hit the street, the people in the know waited for the dust to settle. Soon the panic subsided and gave way to buying up bargains. Tesla (TSLA) at $28.50 was surely a bargain for those who were in the know.
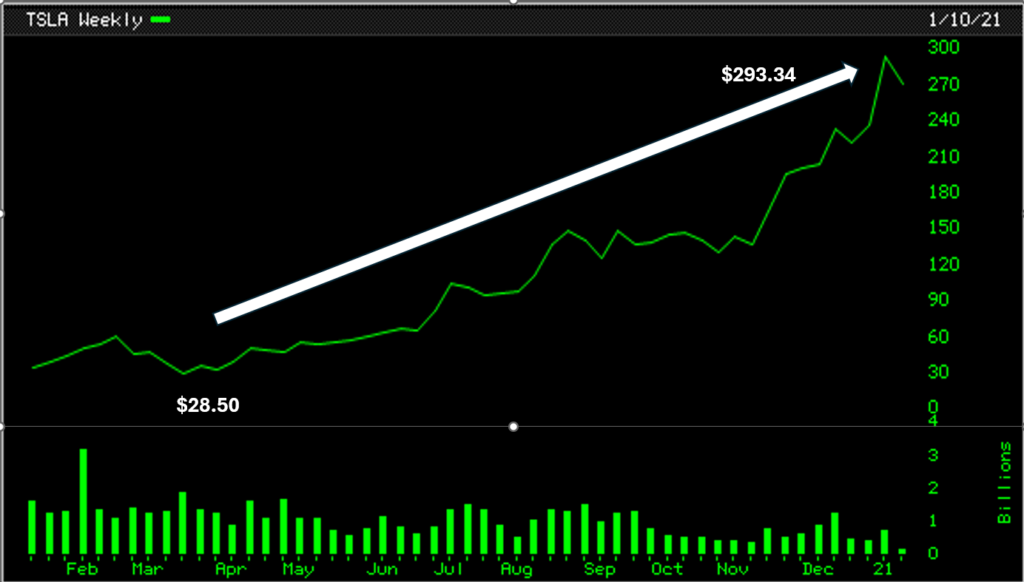
And then, the real move began. Tesla (TSLA) went from $28.50 to almost $300 a share, a ten-fold price increase in nine months.
Is Nvidia (NVDA) Stock Going Up In Price
Just because Tesla (TSLA) acted a certain way, does not mean Nvidia (NVDA) stock will act the same way. The prior base and then the prior uptrend before the next reaction is surely something one sees in a stock poised for a run. But just because something seems a certain way does not mean it is bound to happen.
The human mind plays funny games. When you are long a stock, the human mind does not wish the stock to fall in price. When you are watching a stock run up, your mind wants it to fall so you can see if the stock can resume its trend.
A mind is a terrible thing to use in the stock market. You need rules to eliminate emotion driven actions.
Where Is The Price Support For Nvidia (NVDA) Stock?
Let us assume that there is a reaction coming on Nvidia (NVDA) stock. If it were to happen, where is the support? Where will buyers consider its price a bargain? Where will the big money insiders support its price? What if there are new players coming in to play the game and what if these new players are some folks with really deep pockets? At what price will they want to enter the game?
What if there are buyers at Nvidia’s 10-week or 50-day moving average? Where is that price? As of today, where do you see that kind of support potentially coming in?
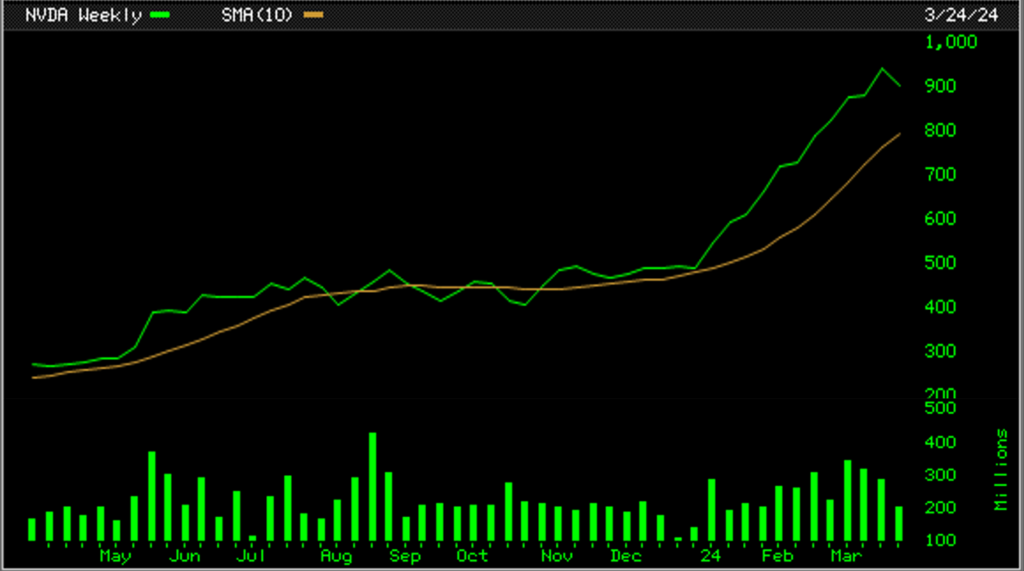
Take a look at this chart. The chart says the current 10-week, or 50-day support line is at $793.04. But this will move as the price of NVDA moves. This is today’s snapshot, as of April 1, 2024. But let us say there are other deep pocket players in this game. They wish the stock to drop further before supporting Nvidia’s stock price. What if this second group of buyers wants to push the price down further so they can buy it at a lower price?
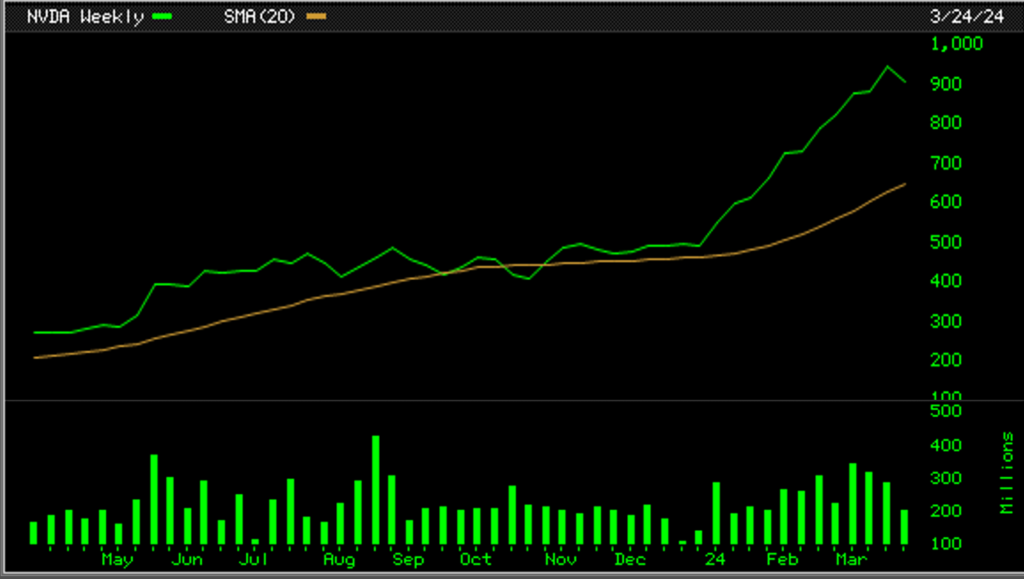
That would pop up Nvidia’s 20-week or its 100-day moving average. A quick look at its chart below shows that line to be at $647.46.
What if there are short sellers also in the market? There are players on all sides of the equation in an active and trending stock. A moving stock always invites all kinds of players, which makes an active stock even more active. Even when an active stock is dormant, there is action behind the scenes, under the radar going on. Let us suppose just like Tesla (TSLA) stock in 2019 and 2020, Nvidia (NVDA) gives up all of its recent gains and continues down further from its 20-week or 100-day moving average line. Where would its next support be?
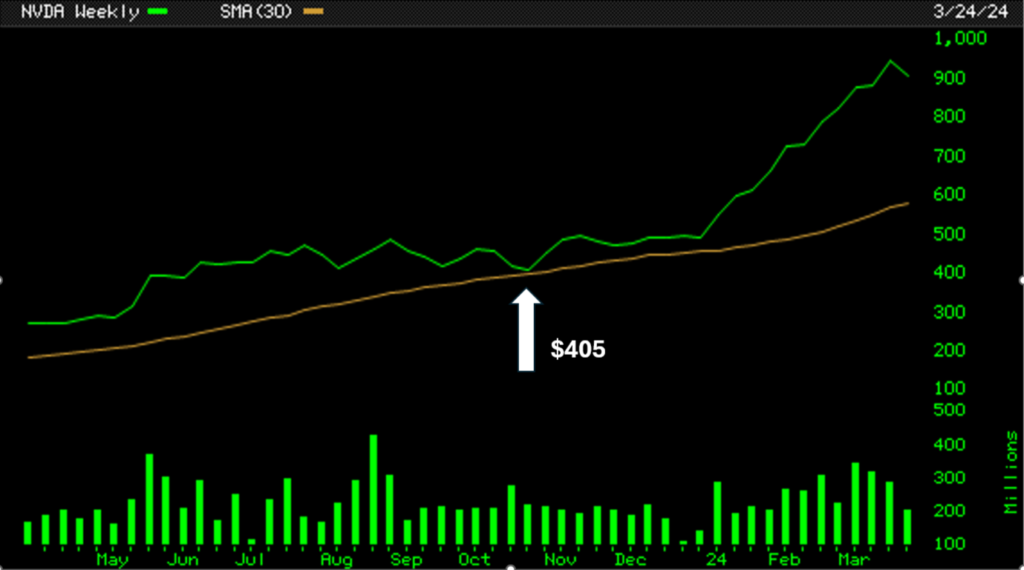
How convenient? The low of the last base is supported by Nvidia’s (NVDA) 30-week or 150-day moving average at $405 as shown. And the same support line is today at $587.65.
For momentum traders or traders, it does not matter much where the support comes in as long as it does not hit their sell-stops. What is far more significant is whether after a reaction Nvidia (NVDA) can make new higher highs?
Whichever way the winds blow for Nvidia (NVDA), there is always an action plan for the disciplined speculator.