Successful Trading Is Ninety Percent Mental
The human brain is amazing. All the accomplishments in science and technology should be proof enough of the brain’s immense capabilities. Yet, when it comes to money, even the smartest minds cannot function well. A simple example to illustrate.
Suppose you were presented with a hypothetical stock that would go on to more than double in price over a few months. In this day and age of instant gratification, newbies will move on to something more desirable. Doubling one’s money is not so interesting to some folks, and the world of day-trading and “there must be a better way to make a killing in the market” beckons.
For the slightly more experienced folks, doubling one’s money seems like a bit of a pipe dream. But for this example’s sake, let us just play along. Suppose you are told that a $50 stock goes to over $100 in a few months. To most that would seem interesting. Let us then place on the table this chart below as shown. And it is stated that it is not possible to catch the bottom, nor the top, but a realistic scenario of catching the middle part of the move is possible.
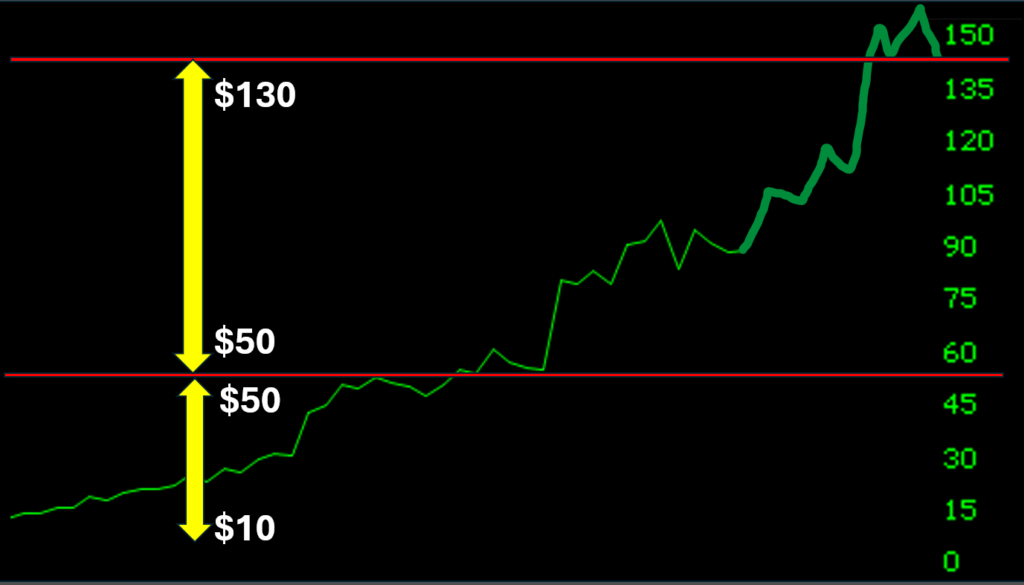
The eyes see this chart, and suddenly the human brain starts acting funny because this is about money. Capturing the main middle meaty part of the move is not enough for the brain. Why can’t we catch all of the move? Why not catch at the very beginning of the move and ride the stock from $10 to all the to $150? That makes the point, doesn’t it? Most human brains lose their capacity when it comes to money.
That is the sole reason to have a set of rules for the game. And one plays the game the right way. To eliminate the human tendencies and weaknesses that have no place in the stock market.
Is Avidity Biosciences (RNA) In An Uptrend?
If you are paying attention beyond the headlines, it is possible to make a case that some stocks are showing signs of life. The fits and starts period of the past few months is looking to settle down to a more sustained period of a stock picker’s market.
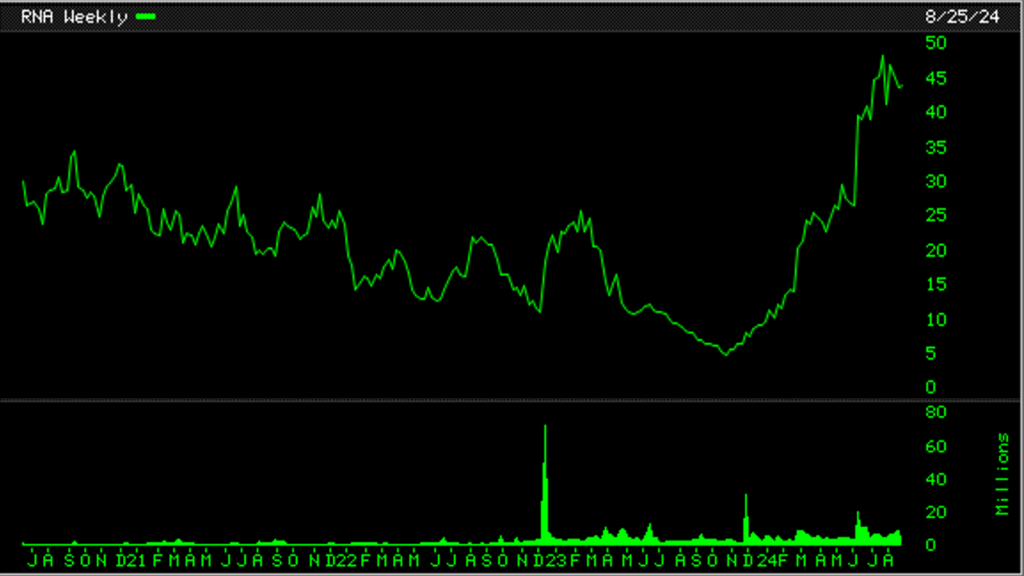
The chart for Avidity Biosciences (RNA) is shown. This is its all-time chart. To most eyes this would mean nothing. To most human minds, a stock chart is of no use. The products sold by the company, its earnings and all the accounting stuff matter much more. To others, some mathematical models and statistical models of prediction mean a lot more. No matter what the approach, indirectly or directly all these methods that ignore charts are solely focused on predicting a stock’s move.
The Need To Observe Avidity Biosciences (RNA) Chart
A speculator has no belief and zero confidence in prediction. He relies on observation and looks to a simple price-volume chart to see what is happening. He has no need for any prediction models. For some reason, the human brain thinks that stocks are sophisticated and require a complicated approach to make profits.
Observe what is happening. Clearly, the stock has been basing in what looks to be a downward but sideways move for over four years. That is a good long set-up phase.
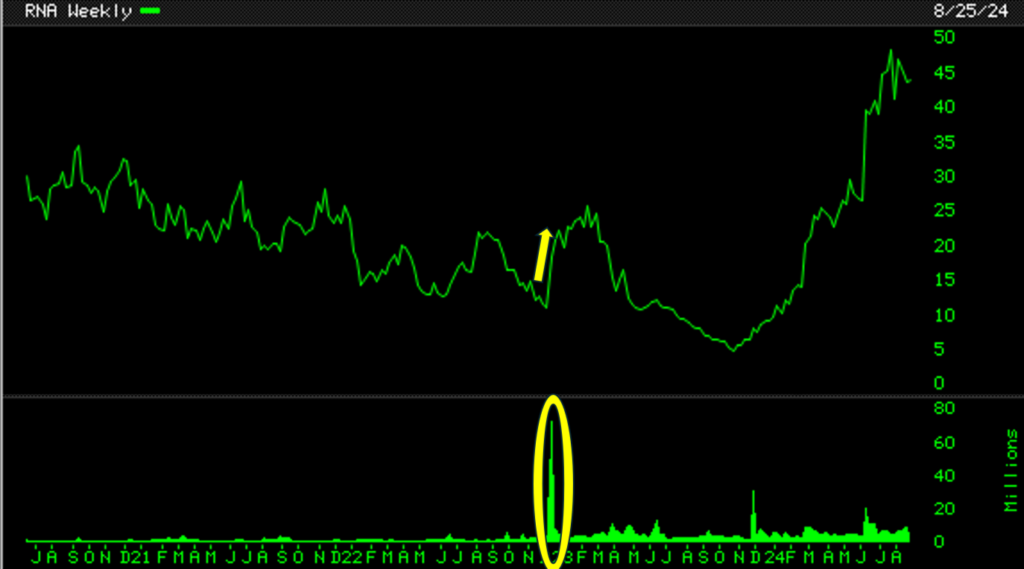
The price volume action in late 2023, shown in yellow on the chart, was an attempt to change its course. But either the overall conditions were not right or maybe the insiders just didn’t have enough juice to end its basing pattern and begin an uptrend.
Avidity Biosciences (RNA) Stock Chart Says…
For months we have been relying on our conclusion that November 2023 was the real turn in the market. A turn that indicated that test buying was an activity worth undertaking to get the measure of the market. Avidity Biosciences lines up with that conclusion. It seems to have taken out all the prior lows and having removed all the sellers out of the way, an uptrend seems to have been started.
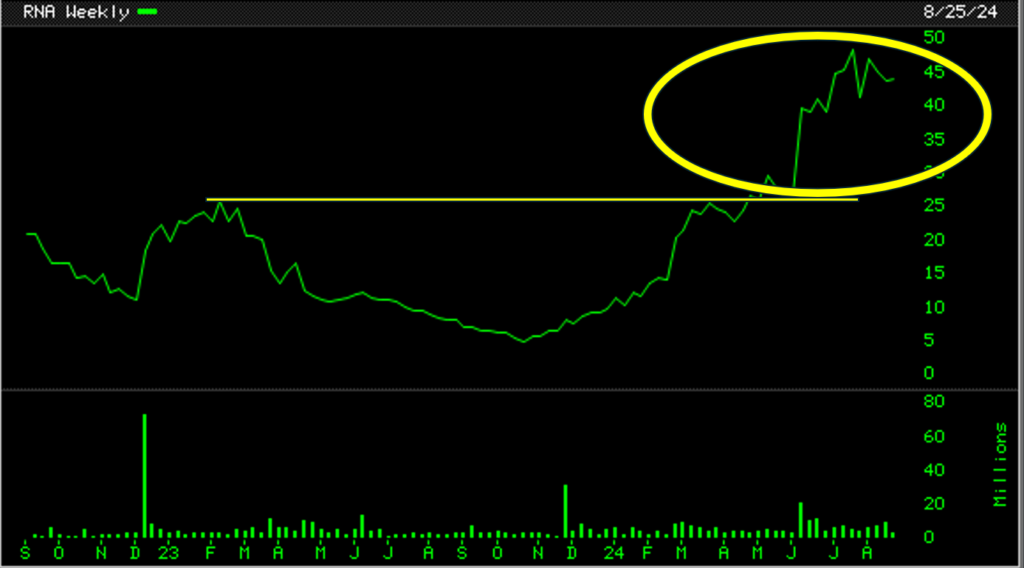
To most human brains, as discussed earlier, it would seem the move has passed by and it is too late. The current resting phase circled in yellow in the chart above means nothing to most folks. The mind programming of predicting, of anticipating, of hoping and wishing, is so hard to deprogram and then reprogram.
The way the mind should work is the other way around. One’s mind should say, “If we are in good market conditions, this stock should act well.” And the action is taken in real-time at each juncture according to the rules of speculation.
Avidity Biosciences (RNA) Stock Has A Tendency To..
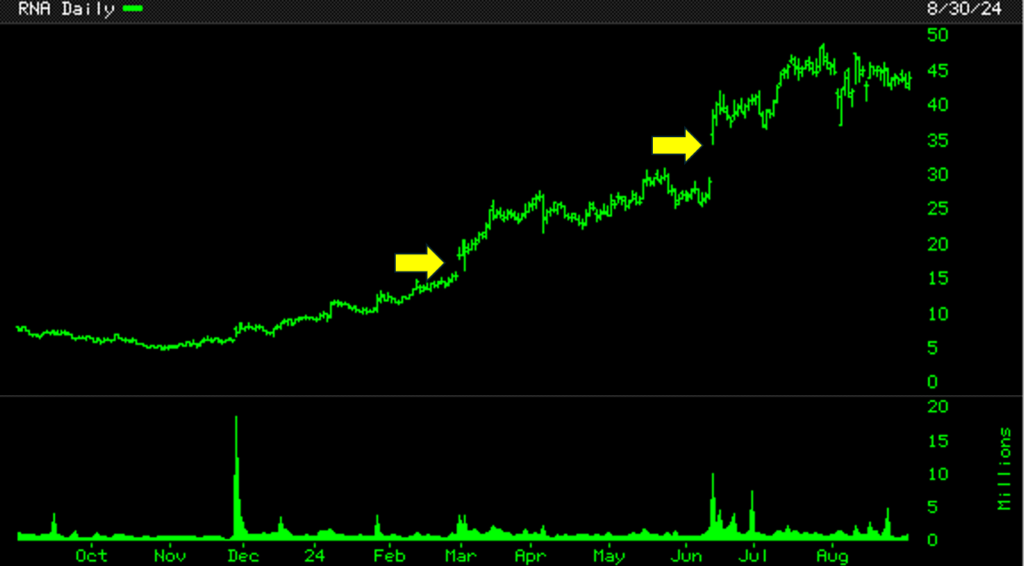
Anyone who follows any sport knows that each superstar has his or her own tendencies. Michael Jordan had his tendencies, tongue out, and all the other tendencies. Babe Ruth had his, pointing to the spot where he could hit. Muhammed Ali had his. Tom Brady, cool under pressure. Similarly, every stock has its own tendency. Along the way of its movement, as more and more new players hop on its moving train, its tendency starts to change. This only makes sense to those who observe. It takes time to develop these skills. But the endeavor to develop these skills is well worth it. The chart below shows the tendency of Avidity Biosciences (RNA) stock. Are you able to talk to yourself in the mirror about your observations? Because the journey through the stock market is and should be a solitary journey. If you must talk, talk to yourself in the mirror, and no one else.
Avidity Biosciences (RNA) Chart Shows That…
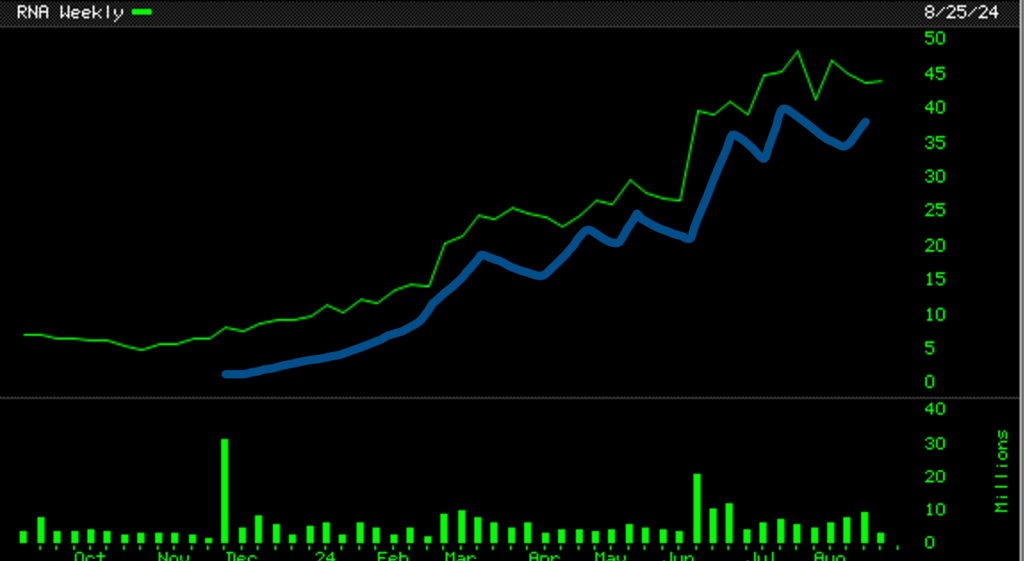
The picture is plain as plain can be. Yet again, one could talk to oneself in the mirror and state the obvious. If you check on your own, and jot down the highs and lows all along its path, the uptrend is unmistakable. Just playing along the right way and taking what the market gives is always the best approach. It is when one starts to force or be more aggressive than one should be at the wrong time or less aggressive than one should be at the right time that moves are missed. Or hits taken.
Is Avidity Biosciences (RNA) a rising stock? What is that facing staring back in the mirror saying?