

Charts Of The Month
For the serious stock market student => Download the assignment below and do that assignment first to learn more about yourself and your decision making skills. You can always come back to his article after you finish the assignment below:
The chart for TEAM (Atlassian) has been already shown on YouTube By Alan https://youtu.be/iQQ4nOTFZ-8 . Here is the reproduction just to get you warmed up.
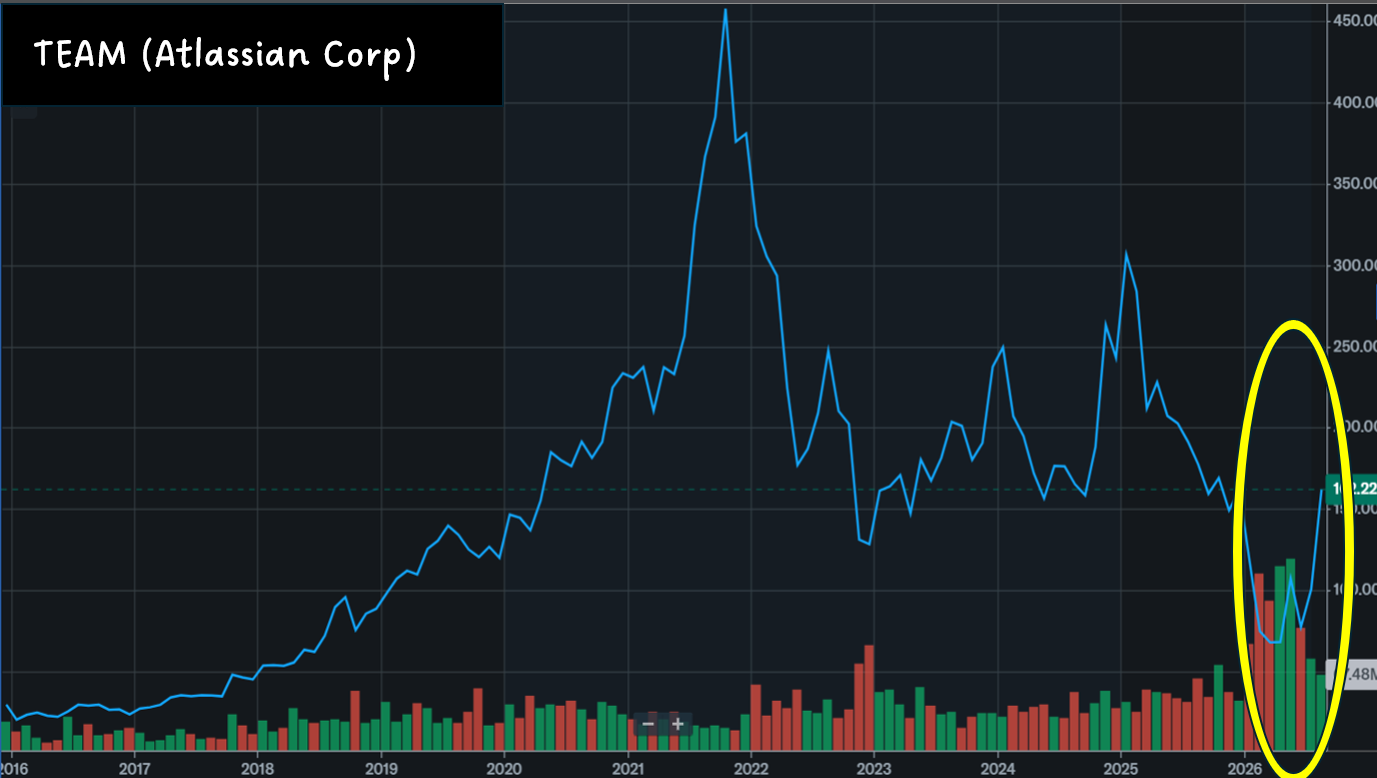
Some basic questions one should answer are the simplest ones. Is there something that is clearly observable? And based on the observation of the chart, is there something clearly interpretable? In other words, is there something concrete enough, within the parameters that a stock chart allows, that one can conclude? In other words, is there a trend or the beginning or a trend or an ending of a trend that can be observed?
Let us assume that one observes, whether rightly or wrongly, that the price/volume action on this chart shows that TEAM (Atlassian Corp) seems to be bottoming out. Based on this observation, one could conclude that an end of its down trend has come about and moreover, a new uptrend might have begun.
The final question after the observation and the interpretation is whether the stock and its chart shows an actionable trade. It the this action that will prove to us whether our observation and interpretation are or were correct. If the action proves profitable then our observation and interpretation were correct. On the other hand, should the stock hit our stop and get us out of the stock, it is likely that we were wrong.
Having outlined the simplest of the steps of a speculator, would you be able to test your observations, interpretations, and actions (which for now a novice should keep as paper trades) using the charts below. The identities of the charts will be revealed at the end of this article. Try to discipline yourself to not jump to the end of the article to find out the identities of the stocks.
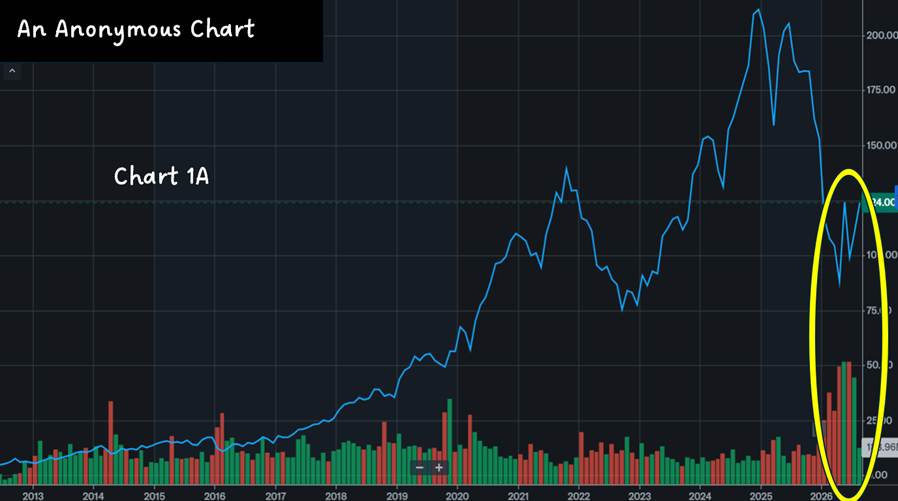
This is Chart 1A. It is an overall view of this stock’s price and volume action. Here are the questions anyone who relies on charts should answer.
- What do I observe?
- Based on what I observed, what can I interpret?
- Based on what interpreted, what action can I take?
- Is the action that I would like to take executable?
- Is there a backstop or a stop-loss that would indicate to me that I am wrong in my observation or interpretation?
- Would I be willing to live with this worst-case scenario should my stop-loss be triggered?
Do you wish for more clues on this chart? What if a closer look is offered? Note all the charts are up-to-date as of market close of August 14, 2026.
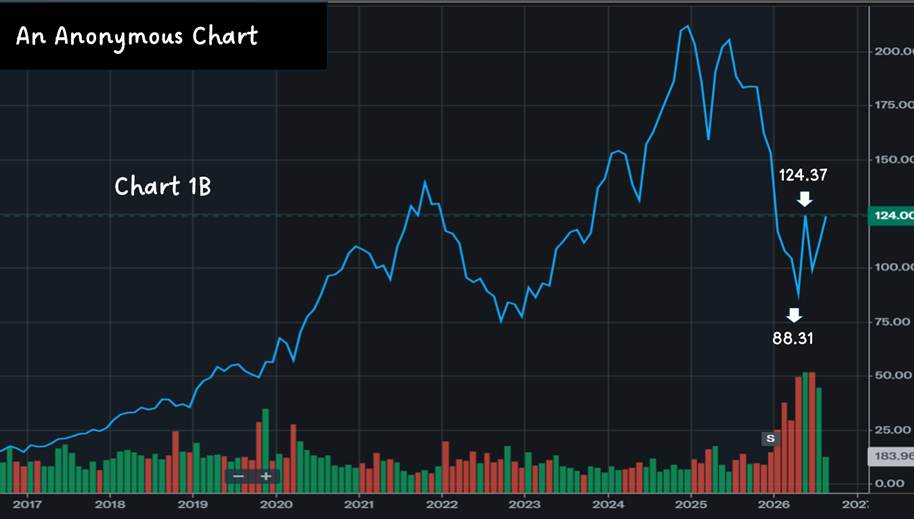
This is a monthly chart. And as a parting gift, I offer yet another clue. Do your homework and check its weekly chart, if I disclose that this is the chart for NOW (ServiceNow). Will your answers to the above questions change? If so, how, and why?
At this stage you respond to me by saying that the charts of TEAM (Atlassian) and NOW (ServiceNow) are not that reliable. And you wish for a more actionable chart to test your decision-making.
If you have not already done so, this is the last chance to do the assignment above without knowing the identity of the chart below. To help you help yourself, I recommend that you stop reading here and go to the download above at the beginning of the article and download the assignment. On the other hand, if you wish to just get to the answer without putting forth the effort, read on as the identity of the stock below will be revealed so you can check the charts on your own.
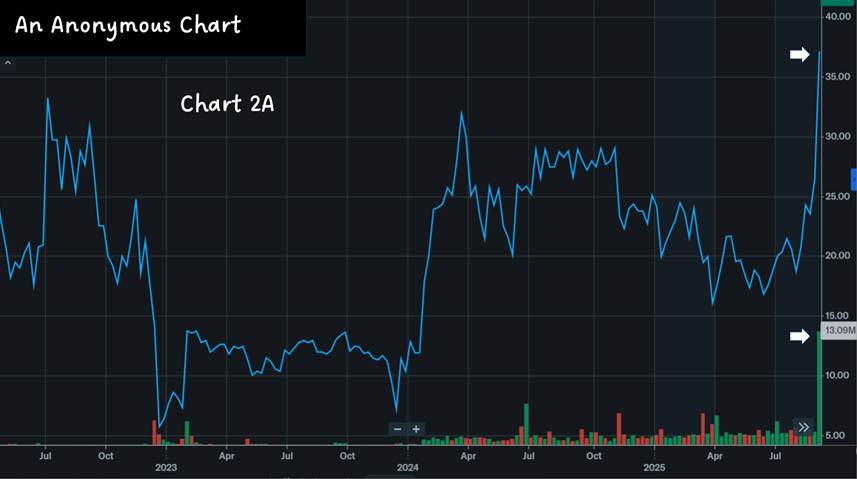
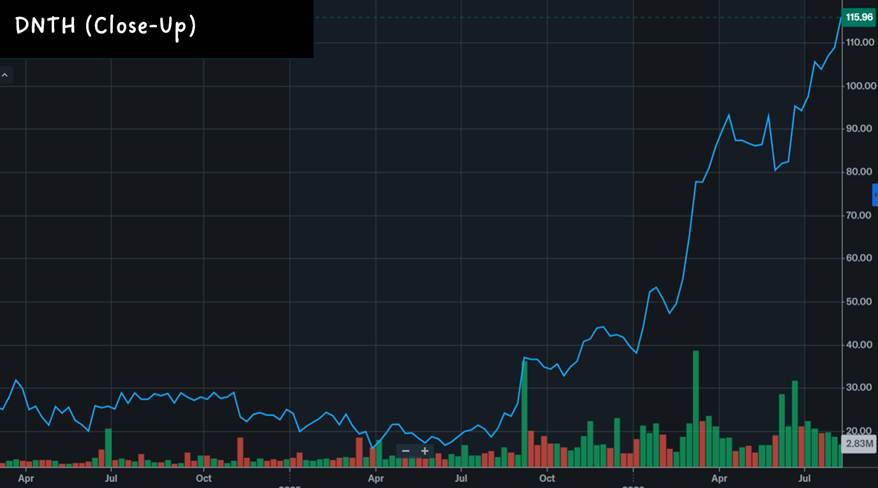
If you are still reading this article, you may be short-changing yourself. The best way to practice is to not know the stock’s identity. Last chance to be a more disciplined speculator. And the stock in the downloadable assignment is: DNTH (Dianthus).

 Spanish
  English