
Can Lyft (LYFT) Stock Lift Your Stock Portfolio? Is Uber (UBER) A Better Stock Than Lyft (LYFT)?
Some folks like Uber, others prefer Lyft. And the answer may vary depending on your own personal experience as well as where in the United States you are located. As in most cases, we humans attach an outsized portion of weight to bad experiences than we do to good experiences. Suppose you had one terrible experience out of ten Uber rides. For whatever reason, you will tend to remember that one unpleasant experience over the other nine experiences that might have ranged from good to excellent. On the other hand, let us say you had ten average experiences on Lyft. And if someone asked you if you liked Uber or Lyft, that one unpleasant experience on Uber may tilt you to say that Uber is not good and hence, Lyft was better. Similarly, if the reverse had happened and the terrible experience had been on Lyft, you would still tend to remember that one unpleasant experience and allow it to overshadow all other good experiences and state your preference for Uber over Lyft this time.
What about when it comes to your stock portfolio? Is your answer going to be along the same lines? If Uber made a better return over the past three years, does that mean Uber is a better bet for the next year? Or would you say to yourself, “Well, Uber (UBER) ran up three-fold in the past three years. But Lyft (LYFT) has not followed suit. So, Lyft has more potential to go up in this upcoming year.”
What if you decide to look at their price-volume charts? Does anything stand out or separate itself that makes one better than the other? Will your eyes see what the two stocks are trying to tell us? Do you trust your eyes? Or do you trust some strange hodge-podge of ratios concocted by Wall-Street analysts such P/E ratio or book ratio or whatever other ratios these white shirts want you to follow. How about the financial statements for UBER vs LYFT? Do you pay attention to earnings or losses?
You do not believe in charts? You do not want to see where the market is supporting these stocks? Or where they are letting these stocks go from their holdings?
Oh, I see. You do not believe in charts showing you trends? Is the past twenty years of increased internet use a trend? Or how about the rising number of Instagram or TikTok users in recent years? Or the rise in online shopping over the past decade? Are these not trends? And how do you recognize trends? Yes, you got it – by looking at the charts! It is acceptable to use charts to look at trends when you want to talk about internet shopping or mobile phone usage. But your mind has a closed door when it comes to charts of stocks? Aren’t we human beings strange?
What Does The Stock Chart Of Uber Technologies (UBER) Say?
Suppose I place this chart of Uber in front of you. And suppose you do not look to stock charts for what the stock is saying because you do not believe in charts. But as an experiment, since you are the curious type, you are willing to go along and give this chart a look-see.
It is a three-year chart, in remarkably simple form, for Uber Technologies (symbol: UBER).
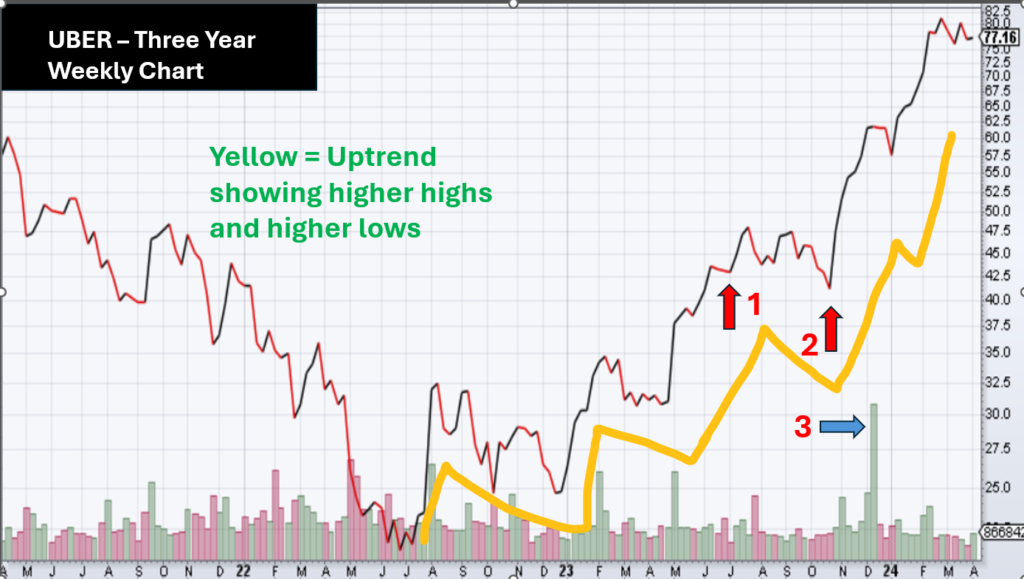
If I asked you to follow along the yellow hand drawn line, what do you think is the first thing that pops into your mind? It clearly shows that the stock price of Uber Technologies (symbol: UBER) has shown a tendency to go up, then go down a bit, and then go higher in price. All along it seems that the price move higher is more than its reaction and price pullback. If you are in the mood to think a little bit and pay closer attention, you will notice that the only time a prior low or a prior pullback was undercut in price was at point #2 when it went a bit below the price at point #1.
To keep matters simple, just take my word that #2 undercut #1 by less than $3. Less than 10%. Suppose you had a rule that a winning stock does not undercut its prior low more than 10% to keep your human emotions out of stock trading, how long would you hold on to UBER?
What do you think point #3 shows on the chart? It may not be anything. Or maybe something.
What Does The Stock Chart Of Lyft, Inc. (LYFT) Say?
Set aside whether you have used Uber or not. Or whether you have used Lyft or not. Or whether you study stock charts or not. Having read up until this point and having seen the stock chart for Uber technologies (UBER), compare your view of Uber to the stock chart of Lyft, Inc. (LYFT).
This is a one-year weekly chart of LYFT. Once again, the yellow hand-drawn lines show a trend, a rising trend until today. Knowing how stocks work, that trend could be shaken tomorrow. And the combination of the two green arrows depicted by #1 and #2 tell you…what? There was a heavy volume of trading that occurred as LYFT made new price highs off of its prior low. So far, after that one week of heavy volume, LYFT has not undercut its prior low. But you know how the stock market works. Just when you think one thing is going to happen, the exact opposite happens.
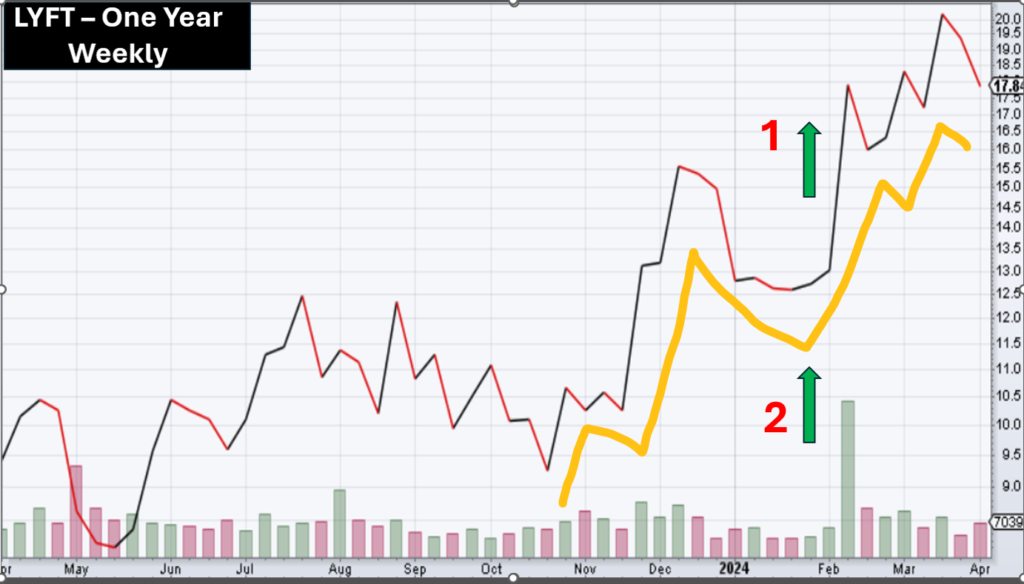
Suppose I suggest that you dig a bit deeper into that part of the chart that showed the price-volume explosion at point #1 and #2 in the above chart. And lo and behold, a six-month daily chart of LYFT pops up in front of your eyes.
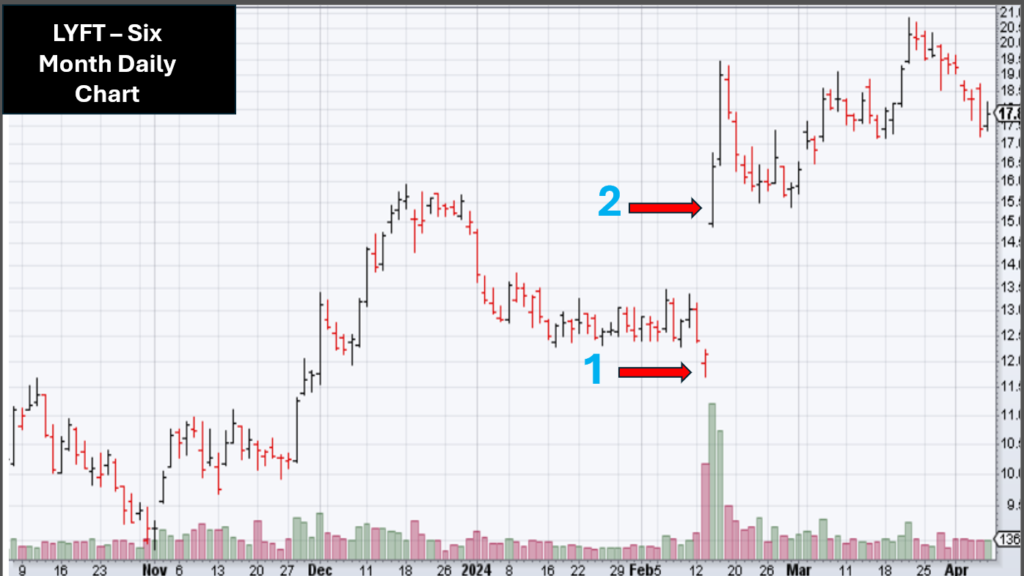
What does the new point #1 in this chart say? And what does point #2 say? Nothing? Something? Everything? At point number #1 (before you came to know about the action of the following day), it seemed like some heavy selling came in on LYFT stock to have its price gap down. But somebody knew what was going to happen the next day. Somebody with deep pockets knew something. So, what did they do? Did they sell on that day as shown by point #2?
Just like you, if I knew on the day of point #1 what was going to happen on the following day, I would get ready to buy up all that is being sold on the market. Folks with deep pockets have to spend an enormous amount of funds and an enormous amount of time to accumulate their holdings. Only these really deep pockets know what they want the stock to do and have it in their capacity to make it happen. They know things that we outsiders can never dream of knowing.
The real challenge is whether we, as outsiders, can find a way to act like the insiders? But without risking anything significant. That is the reason I hate stocks. Stocks are bad.