Is Nvidia (NVDA) A Buy? Or A Sell?
By now everyone around the world has heard of Nvidia (NVDA) stock. The cliché is that when a stock becomes the news headline, it is time to sell. So, is it time to sell Nvidia (NVDA)? Or is there still room for Nvidia (NVDA) to continue its rise? If you think it has topped out, then is it time to go short?
It is easy to blurt out one’s opinion when there is no money on the line. Place a line and suddenly the confidence with which one makes a statement about a stock suddenly drops. That is just human tendency.
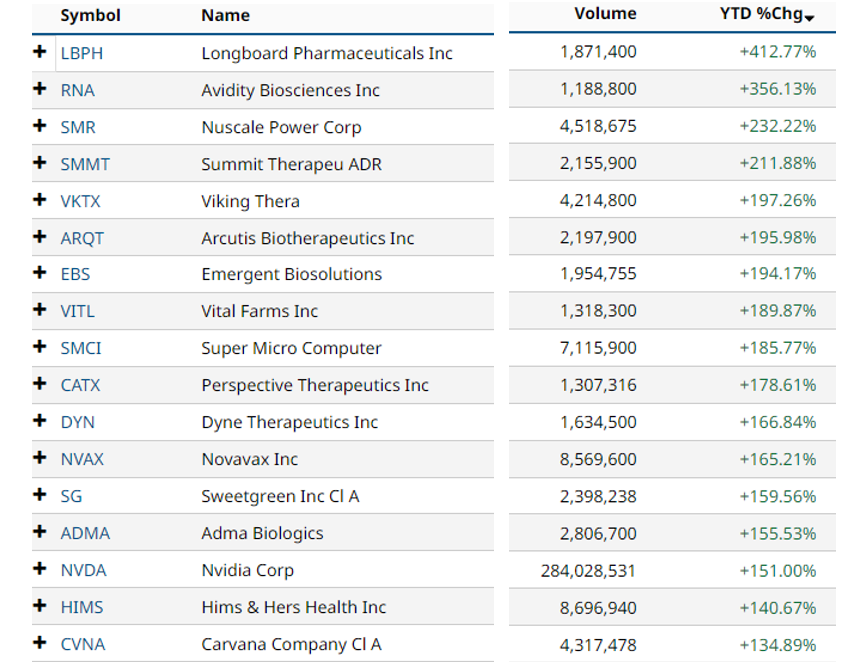
Have you considered that we live in an age where almost any stock that makes even the slightest of moves becomes news and the old cliché probably no longer applies. Just for kicks, suppose we run a stock screen with the following requirements:
Last price = $5
Volume = 1,000,000 daily
YTD Return = 50%
Where in the list do you think Nvidia (NVDA) ranks on this screen? 15th! There are fourteen stocks that have had a better year-to-date return but how many people know any of those fourteen stocks? Is it only because Nvidia (NVDA) has a large number of outstanding shares that it is being followed by more people? Maybe. But since when did stocks having a large number of outstanding shares start becoming the best performing stocks?
I am not a researcher and hence I would not know. But usually, it is the smaller stocks that make the big gains. It is far easier to move a stock with a lesser number of outstanding shares than a behemoth like Nvidia (NVDA). But we are in an environment of recovery post 24-months of a bear market. You react to what is and not to what should be.
All this is just fun to talk about but what if one is only interested in profits in the stock market? What use is Nvidia (NVDA) stock to such a person? Could one have really traded the stock using common sense principles? And if so, what is its current status? Is it in an uptrend?
Suppose you look at Nvidia’s charts. What do you think you will find? How are your observation skills? Are they biased one way or the other? If you own the stock, you will be clearly biased one way. If you do not own the stock, there is a chance that you might still be biased, perhaps the other way. Is there a way to remove that bias and just look at the chart and observe with a cool aloof distance?
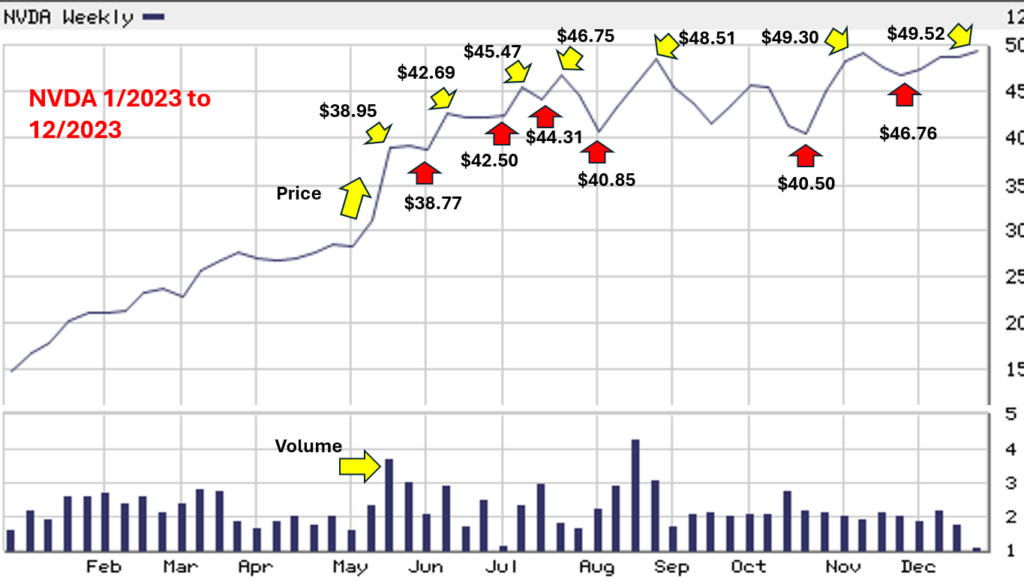
This is Nvidia (NVDA) stock chart for the period from January 2023 to December 2023. For the entire year of 2023. If anyone says that they can catch the bottom of a stock’s move, tell them to go look up what is said about those claiming to catch the bottom of a move.
The first clue that an uptrend might have begun was when the volume rise coincided with the price rise as shown. Thereafter, you are looking to see if Nvidia is consistently making a series of higher highs and higher lows. It is during this trend that profits can be made. For the early part, from the high pegged at $38.95 to the high at $48.51, the highs seem to be intact. There is one blip when the low at $40.85 is below the prior low of $44.31 but it does not hit a stop if you are using 10% below the last low as your stop.
So, you escape the stop at $40.85 and the stock goes on to make a new higher high at $48.51. And you think you survived an attempt at a shakeout by not selling out at the reaction low at $40.31.
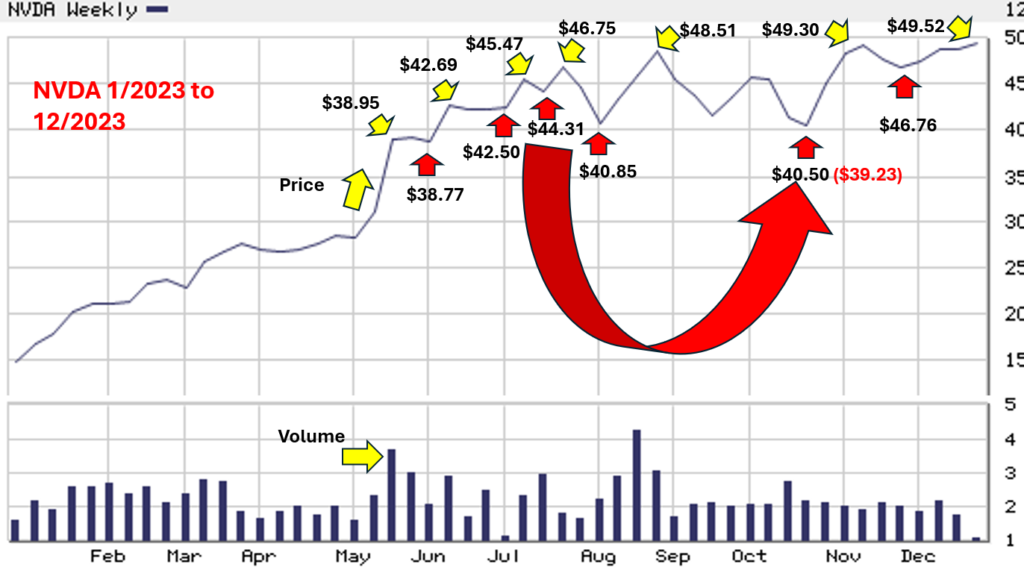
But not so fast! Do not be so quick to pat yourself on the back as Nvidia (NVDA) stock is smarter than you. And sure enough, she comes back and hits your stop as she makes an intraday low at $39.23 in late October 2023. And you get sold out of Nvidia (NVDA). The shakeout is shown by the red curve (a metaphor for a curveball).
Now you are thinking, this is October 2023 in real-time, that perhaps Nvidia (NVDA) is not the right stock at the right time. No hindsight available then, nor a crystal ball.
Before you know, it is 2024 and then Nvidia (NVDA) goes and does this as shown below.
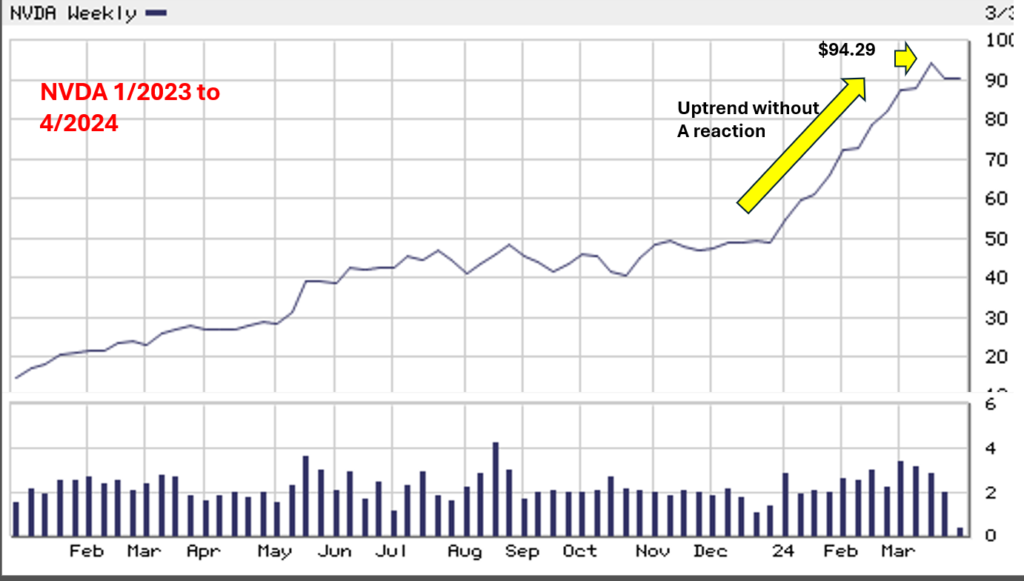
Having shaken you out, she proceeds to run ninety percent in eleven weeks. That is 90% in 11 weeks! And she is laughing at us all the way to over the $1000 price before the 10-for-1 stock split.
What do you do now? Like any speculator, you think to yourself, “Alright, I missed the first leg of the move. Now I have to wait for a reaction to this 90% in 11 weeks move and see what she does.”
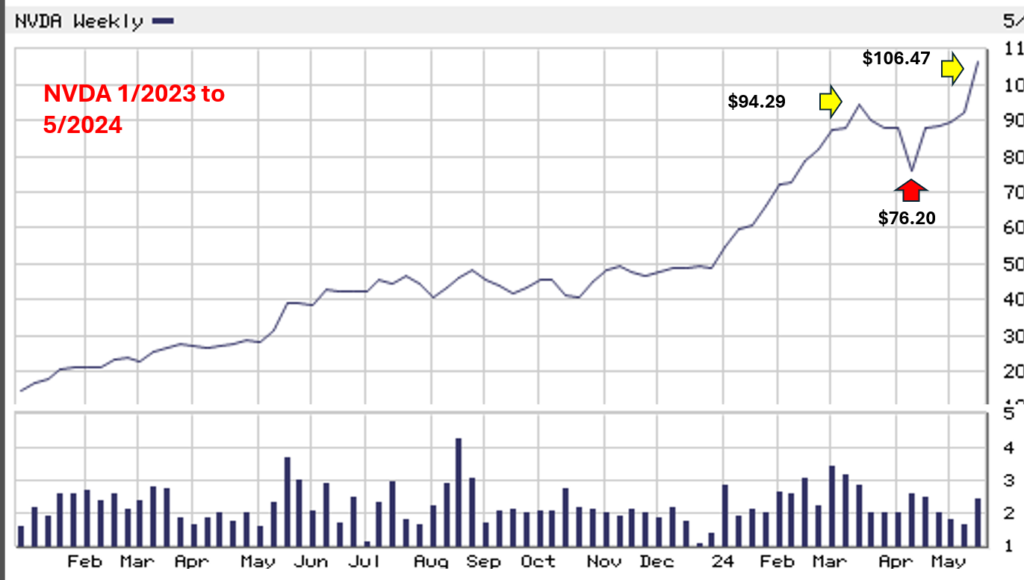
She makes a new high after a few weeks of rest after that 90% in 11 weeks run-up. This is where you are fighting the human tendency against what the eyes are seeing and observing. Clearly the chart shows a new high at $106.47. But the human tendency is to think that “I missed the big move, and any move now is going to be a nothing burger. So why bother with this stock?”
If it had been a stock not named Nvidia (NVDA) and was not receiving coverage in the media like it is, you probably would not think twice and play the game the right way.
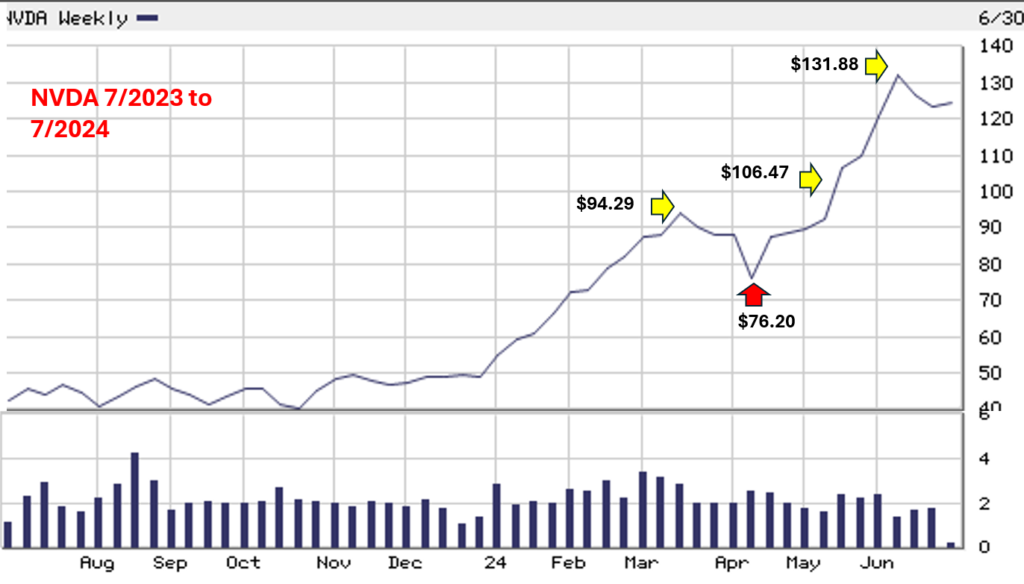
This time the run-up was more like thirty-five percent from the prior high in four weeks. That is not the question of this article. The question is, does Nvidia (NVDA) still have the juice to run-up or is this the end of its run?
There is only one way to find out. You have to be in the stock to find out. If you are in the stock, where is your current sell-stop? If you are in the stock, where is its last low? When will the current uptrend be negated? The answers to these questions will clue you in.
This is where playing the right way matters. Quite frankly, many of the stocks that are on the list from the screener above will offer you plenty of clues. Only if you play them all the right way.
A video synopsis of the article is available here: