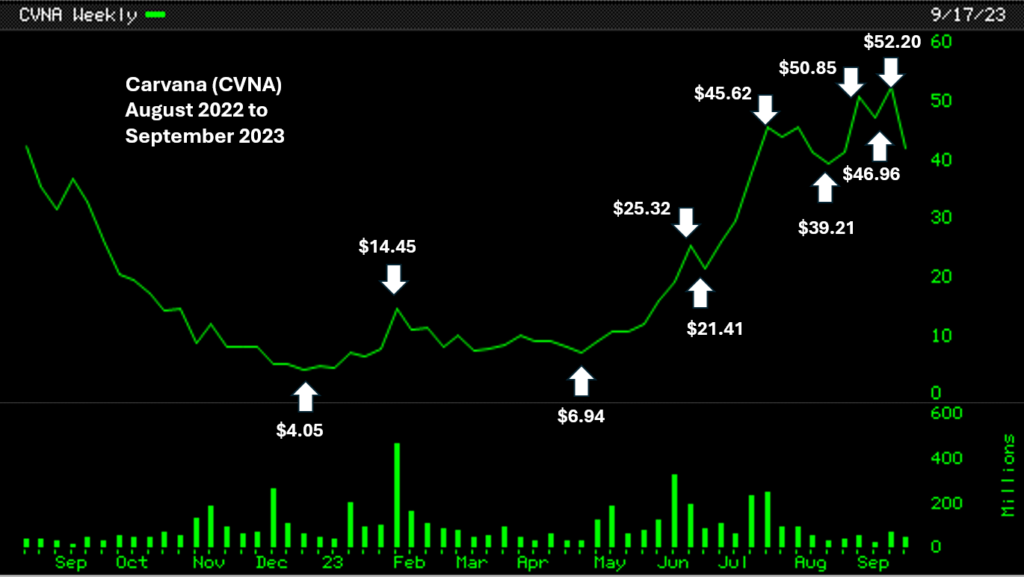
The Lesson From Carvana’s Stock Chart (CVNA)
See the chart below.
What are the three critical things you observe?
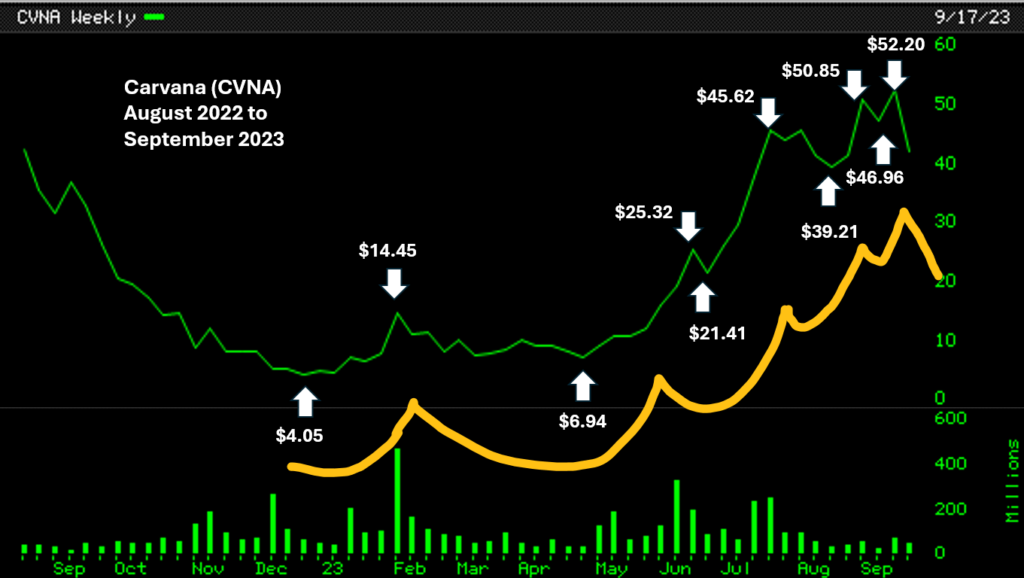
Does the yellow line help in observing something that was otherwise missed on the same Carvana (CVNA) chart?
The charts above were for the period of August 2022 to September 2023. Fast forward a bit and look at the chart below. What do you observe now?
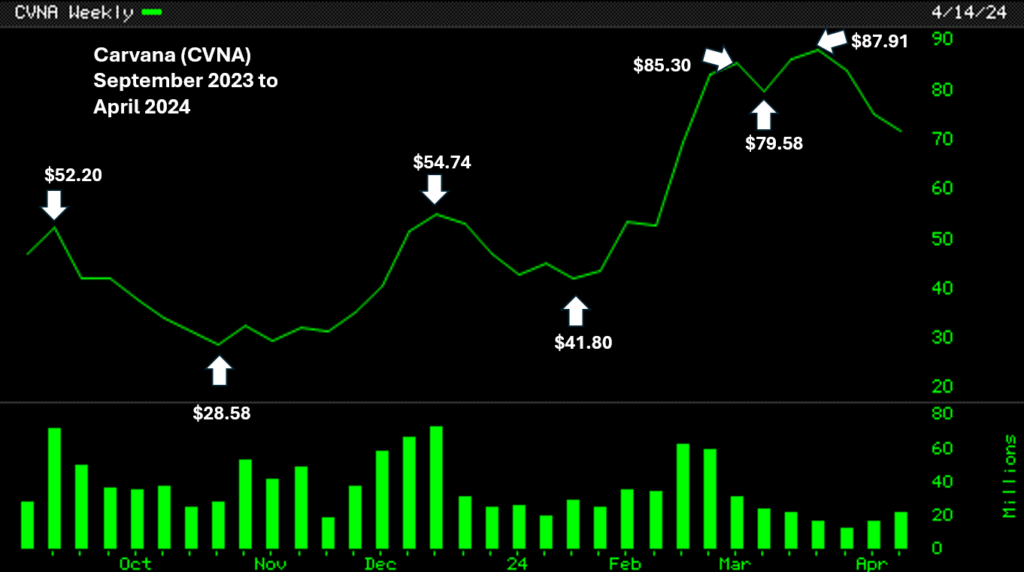
This chart is for the period September 2023 to April 2024 for Carvana (CVNA) stock. Fast forward a bit more and you are presented with the charts below.
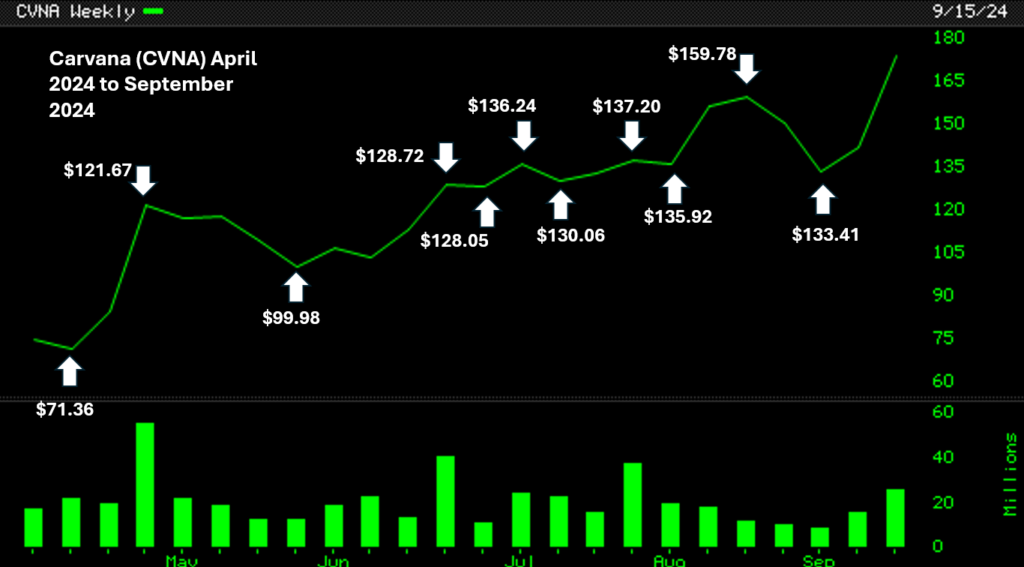
Does adding the yellow line below help with observing things you might have otherwise missed?
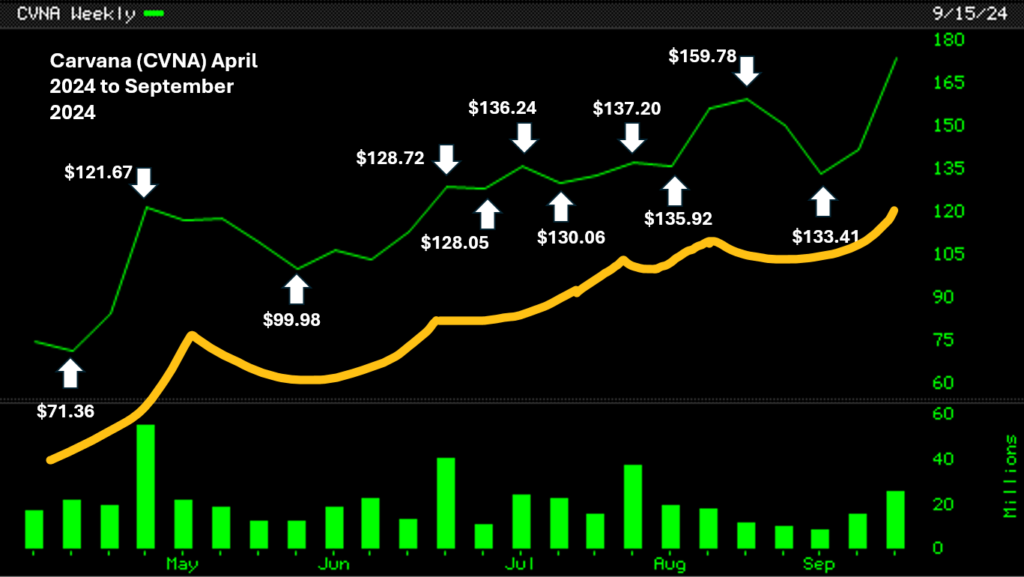
This chart is for the period April 2024 to September 2024.