
What is RVMD Stock Chart Saying?
I am not that smart. Wall Street and the insiders have the best minds and talents working for them. Wall Street is about money and money attracts the best talent. I am a fool and I do foolish things. So why not add an additional foolish thing to my repertoire of foolishness and just follow what the stock chart tells me what Wall Street is doing? I know it’s a foolish approach. It works for me because I am a fool. I will use RVMD and ask that you tell me what each chart is saying as we move along. Maybe you can be just as foolish as me and end up making a profit!
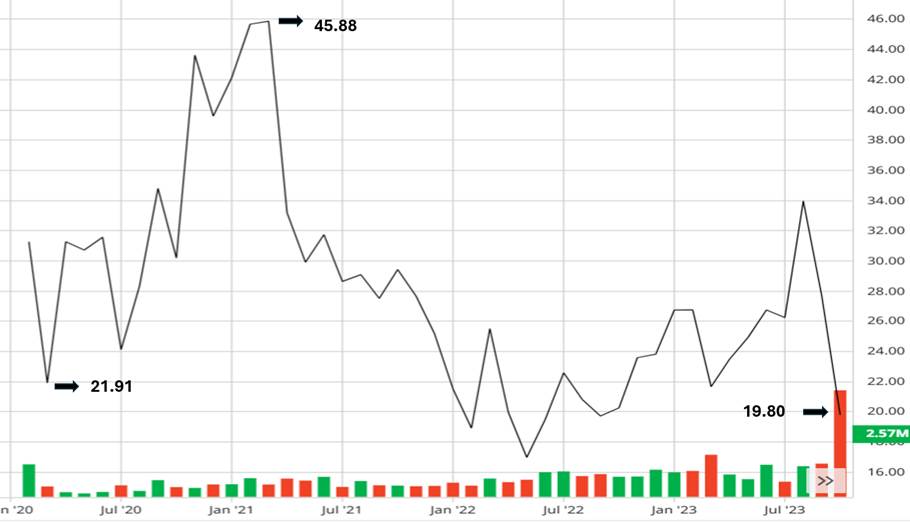
Chart 1
Chart 1 clues for you (hopefully you are doing this on your own by observing the chart before you read these clues) => From its IPO in 2020 at $31.27, RVMD makes an initial move up during the leg from a low of $21.91 to a high of $45.88. And then RVMD retraces all of its gains and more keeping in line with the bear market in equities. A first attempt to restart the upswing is attempted during the mid-2022 to mid-2023 period. But this was too early, well before the bear market had played itself out. Remarkably the October 2023 heavy volume support offered by the insiders at $19.80 coincided with the last sneezes of the bear market.
I forgot to mention on purpose. For now, I am showing you monthly charts. I will switch to weekly charts at some point and I will let you know when. I do not recommend checking RVMD chart on your end. I am trying to show you how you can use simple price/volume charts and make the right decision at the right time.
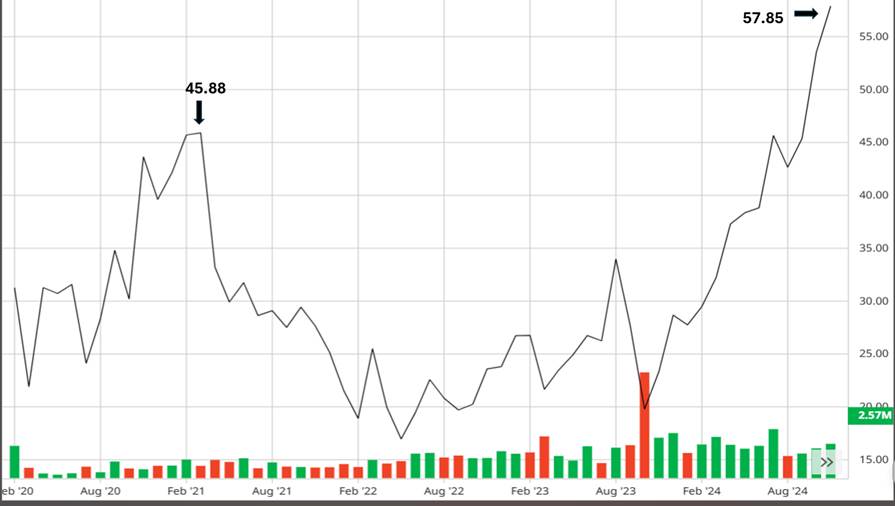
Chart 2
What do you think happened during the month of October 2023 that shows the unusual volume spike? Do not pay attention to the color of the bar. Pay attention to the chart in its simplest form without being too smart. (The insiders with all their brains and money had figured out that October 2023 was the final sneeze of the bear market)
Chart 2 clues for you (hopefully you are doing this on your own by observing the chart before you read these clues) => A new high is pegged at $57.85 above the prior high of $45.88. The low of $19.80 is intact.
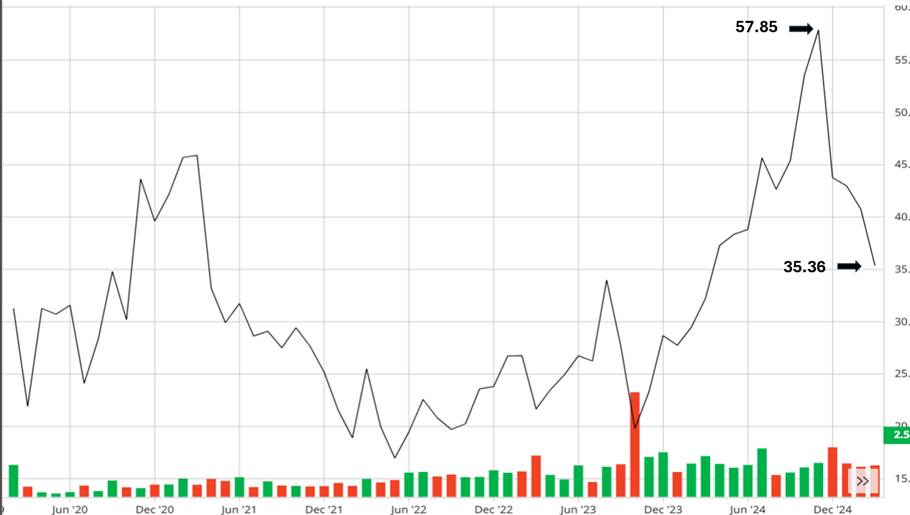
Chart 3
Do you think an uptrend has begun? If so, when did the uptrend start? What makes you say what you say? Based on what you observe, what do you interpret? Is that interpretation actionable? Not all interpretations are actionable, just so you know.
Chart 3 clues for you (hopefully you are doing this on your own by observing the chart before you read these clues) => A reaction to the $57.85 high is pegged at $35.36. The insiders initially supported the stock at $19.80 in October 2023. Now the next support they offer is at $35.36. Clearly, they are supporting the stock at a much higher price than earlier.
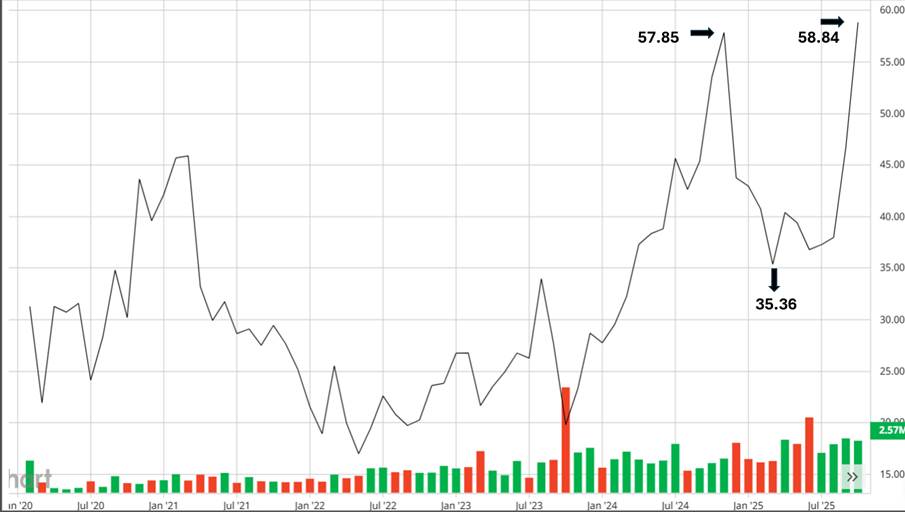
Chart 4
Now I am going to switch to weekly charts. Do you see an uptrend in this chart? What does your observation lead you to interpret? Is that interpretation actionable?
Chart 4 clues for you (hopefully you are doing this on your own by observing the chart before you read these clues) => A new higher high, above the prior high is pegged. $58.84 being higher than $57.85 and $35.36 being a higher low than the prior low of $19.80, the stock is a rising stock. But is this actionable?
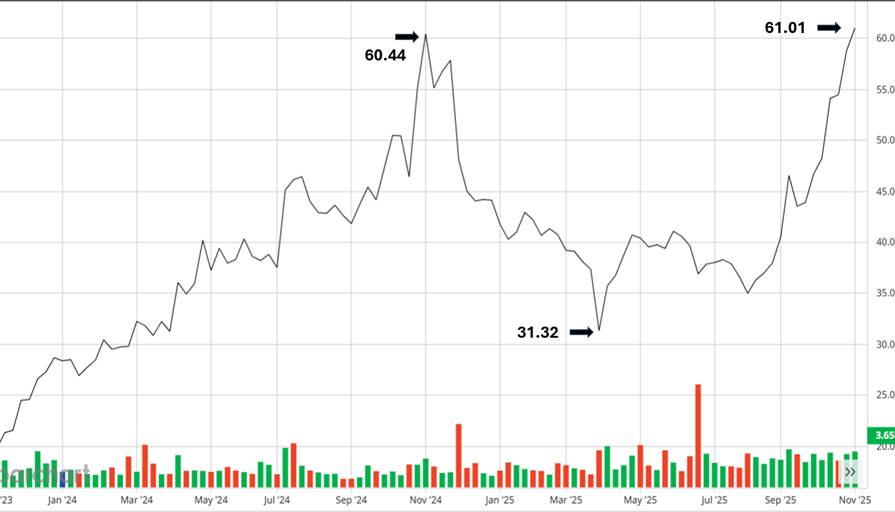
Chart 5
Is the uptrend intact? Is there more confidence in your interpretation? And is that interpretation now actionable? If so, what action do you take?
Chart 5 clues for you (hopefully you are doing this on your own by observing the chart before you read these clues) => I have now switched to weekly charts and all the remaining charts from here on will be weekly charts. On weekly charts, a new higher high, above the prior high is pegged. $61.01 being higher than $60.44 and $31.32 being a higher low than the prior low, the stock is a rising stock. But is this actionable if we switch to weekly charts from monthly charts?
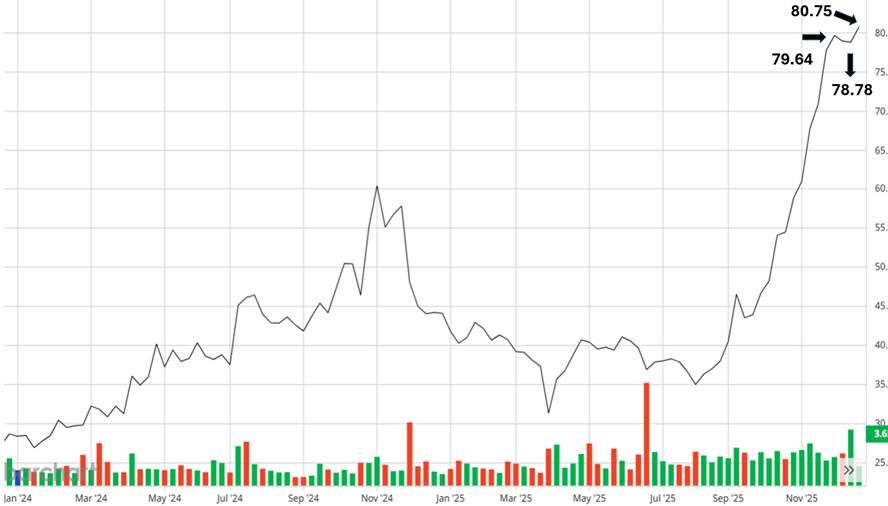
Chart 6
What do you think the insiders are doing now? How and what do you do at this stage?
Chart 6 clues for you (hopefully you are doing this on your own by observing the chart before you read these clues) => On weekly charts, a new higher high, above the prior high is pegged. $80.75 is a higher high than $79.64. Are we now in an actionable phase? If so, what are your actions?
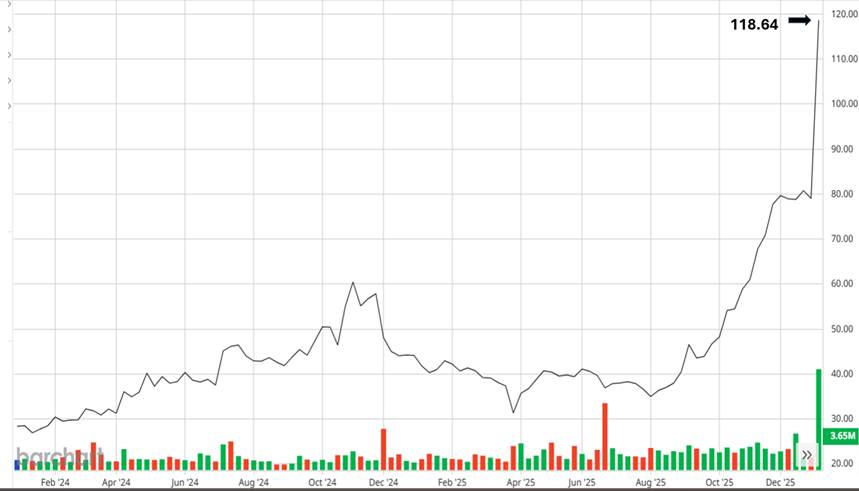
Chart 7
What do you think she is saying now? Are you paying attention to what she is saying?
Chart 7 clues for you (hopefully you are doing this on your own by observing the chart before you read these clues) => On weekly charts, a new higher high, above the prior high is pegged. Without going into any number of nuances presented, what is your first basic simplest observation, interpretation, and action?
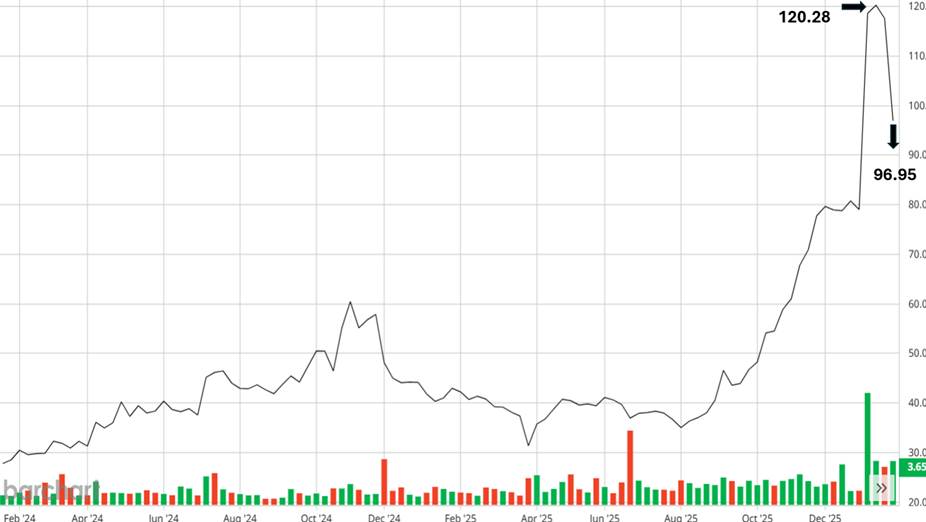
Chart 8
Do you have rules that you follow without fail? Or do you listen to someone on TV or read some social media post or legacy media article?
Chart 8 clues for you (hopefully you are doing this on your own by observing the chart before you read these clues) => A reaction ensues and….
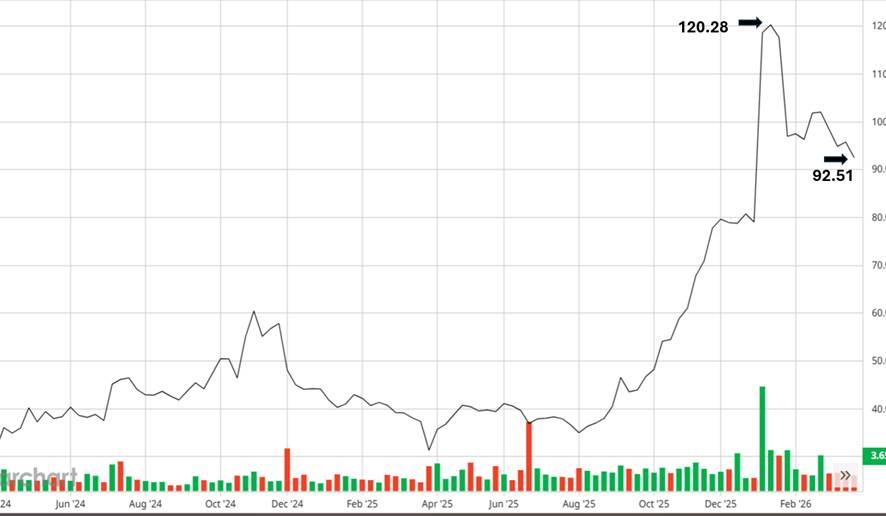
Chart 9
Is she still in an uptrend? Are you reconsidering your decisions? While in the stock market there are no do-overs, this is just an exercise so you are free to do a do-over. Would you change anything with any of your prior interpretations or actions?
Chart 9 clues for you (hopefully you are doing this on your own by observing the chart before you read these clues) => The reaction is still ongoing…..can you find the discipline to sit tight?
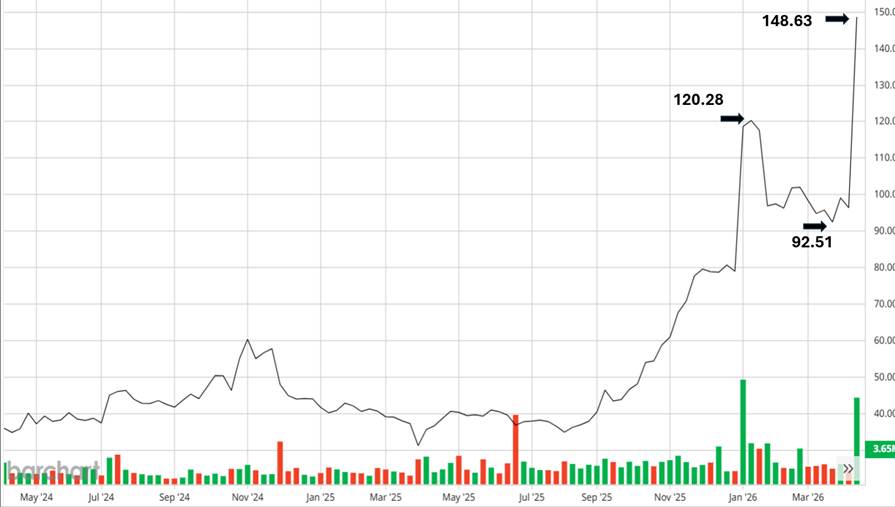
Chart 10
I will stop here for now. I wonder if you made the right observation on each and every chart? Did the right observation lead to the right interpretation? And did the right interpretation lead to the right action? Because you are a smart one, trying to be foolish turns out to be very hard.
Chart 10 clues for you (hopefully you are doing this on your own by observing the chart before you read these clues) => The stock confirms the continuing uptrend.
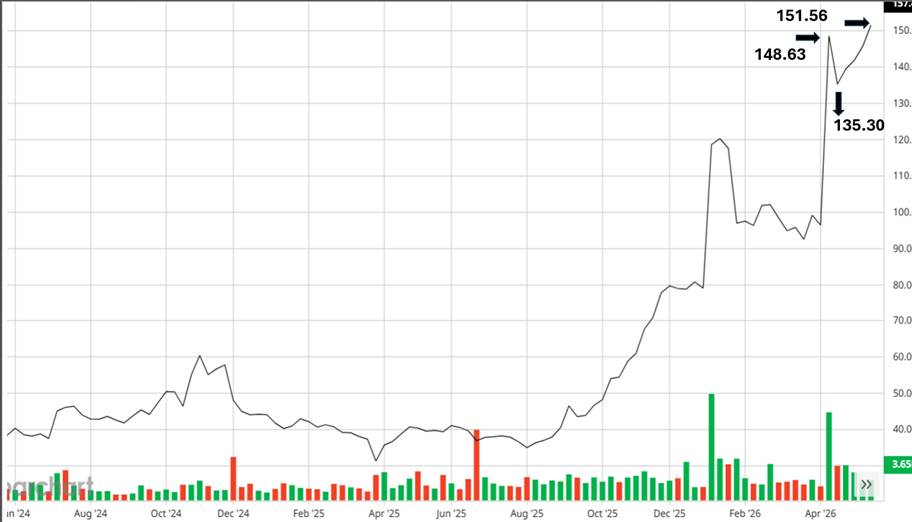
Chart 11
Chart 11 clues for you (hopefully you are doing this on your own by observing the chart before you read these clues) => The stock confirms the continuing uptrend.
As foolish as I am, it turns out that I better stay foolish. No sense trying to be smart. That will only kill my account.