

Any New Stocks For Q3?
Everyone has the same stocks on their watchlist. But the most unexpected stocks make a run. As it should be. If the stocks that everyone thought would run makes the run each and every time then the market will not exist.
There are tens or maybe hundreds of stock picking services for this very reason. All of us can come up with the same or similar short-list of stocks that we can observe that are making a run. The key is always to make the entry at the right time and the exit at the right time. Nobody gets it right each and every time. But if you can increase your odds of being in the right stocks at the right time for the right duration, you can definitely see an improvement in your portfolio performance.
The runaway runs made in the first half of 2026 says what to you? Instead of listening to humans your best bet is to listen to the stocks in your list/holdings. Nobody can catch the bottom as well as the top of a move. However, it is realistic and possible to catch the meaty middle part of a move without facing huge risks. And we all know the market is full of risk. The lure of profits brings the gullible in, the promise of big wins and the slick salesmanship of the Wall Street machinery tells us what we should do and how we should spend our funds. Buyer beware, as the old story goes.
Let us suppose we are have no confidence in the Wall Street machinery. Let us suppose we are skeptical of everything we see and read about stocks. Pretend that we are all fools and foolish in our approach to the market. And we only want to observe charts of a few stocks and determine if they have begun or looking to begin their uptrends. But the tiny savvy part in even the foolish in us tells us to be skeptical of everything about the market unless proven otherwise. Having said all this, see if you can observe these charts of current stocks as of close of Q2, 2026. Are any of these talking to you? What are they saying?
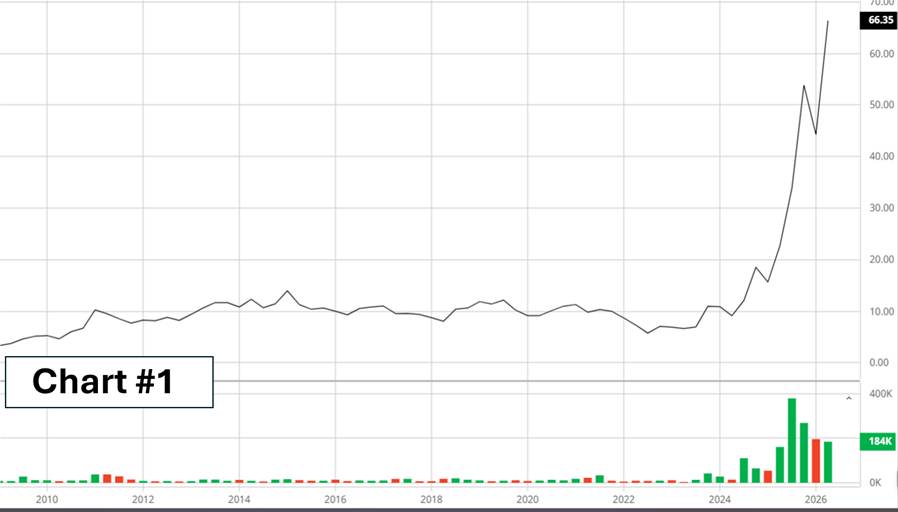
Does this chart depict an uptrend? If so, when did it begin? And what would make you feel the uptrend has been negated? Or that the trend has changed?
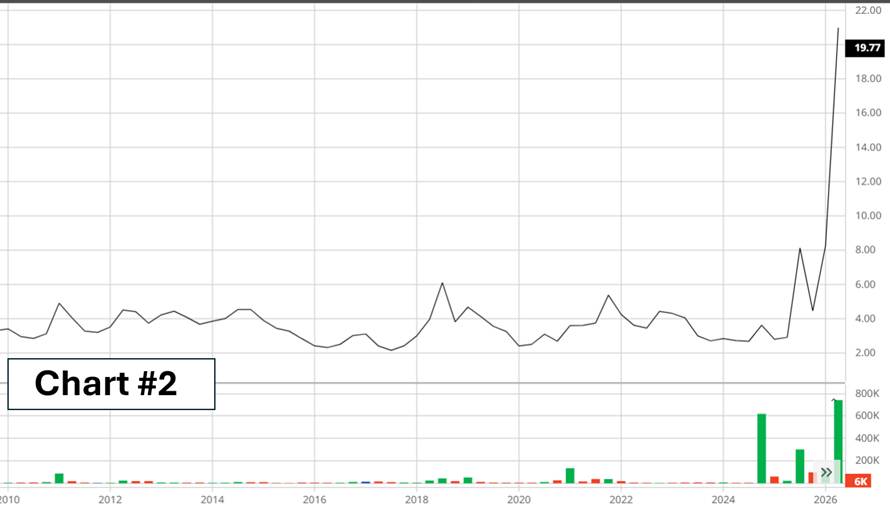
Is this chart any better than the prior chart? Does this chart indicate an uptrend is in progress? If so, when the uptrend begin? How far away is the stop? Can you find a better stop? Which chart would be more actionable? Chart #1 or Chart #2?
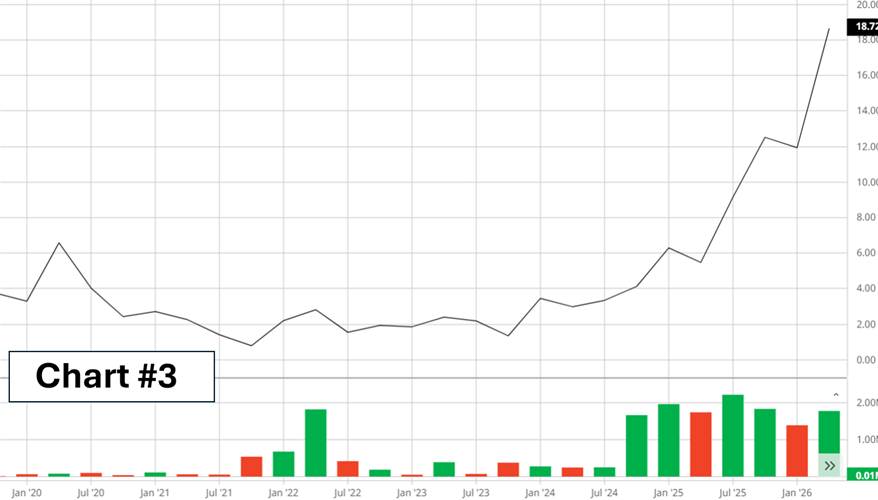
Now you are presented with a third choice. Which of the above three charts seem the best chart to you? Do any of these stock charts invite you to buy the stock? Which one? What if you are only asked to pick one of these three stock charts?
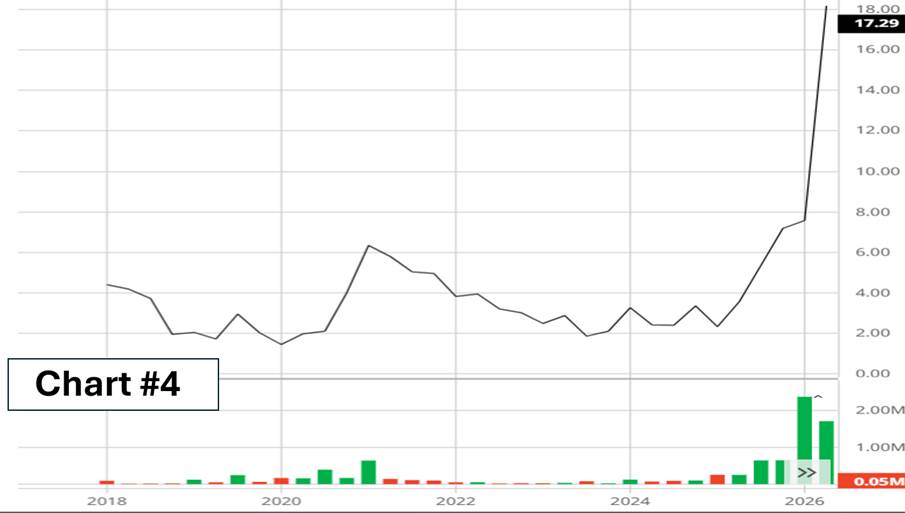
What if I show you this chart and ask you to pick the best one chart out of the above four? Which one will it be? Chart #1? Chart#2? Chart #3? Or Chart #4? Pick one out of these four. This is just an exercise with no repercussions of your choice. Now that you have decided to pick only one of the above charts as the best chart, let us call your choice you made as “Decision #1.” Set aside your Decision #1 for now in your hip pocket. And walk away for 30 minutes. Come back in 30 minutes and take a look at the additional charts below.
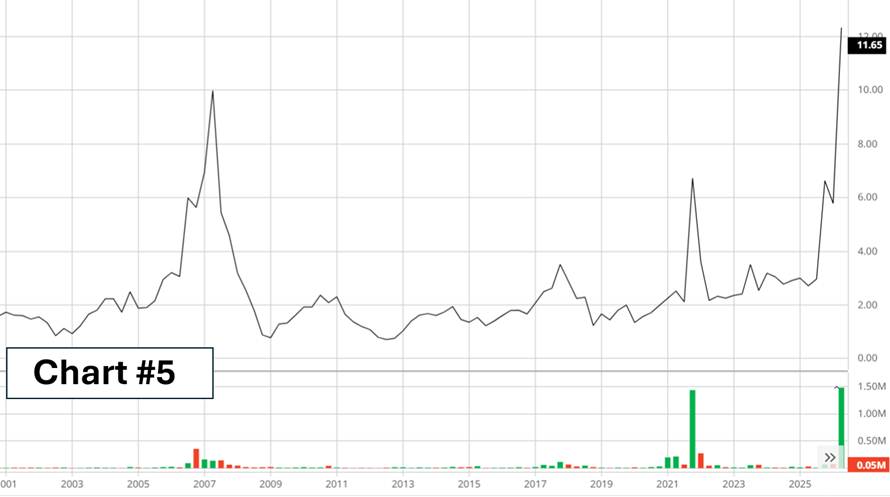
Is this chart any better than your Decision #1?
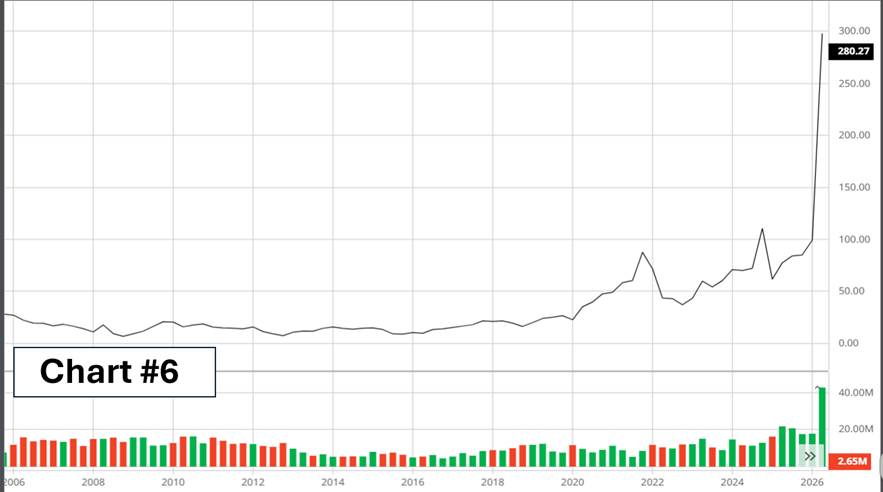
Is this chart any better than your Decision #1? Is Chart #6 better than Chart #5?
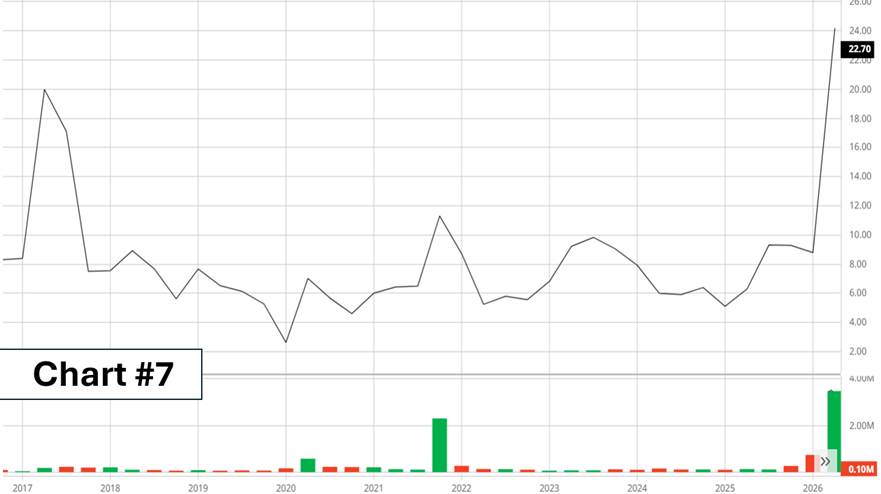
Now that you have observed all seven charts, which is the best looking chart? What happens if instead of just these seven charts you end up with twenty charts that you have to sift through and select the best option?
As I said earlier, it is easy to show you a set of stocks and charts that look good and seem to be in an uptrend. Anyone can do that including you yourself. You just need a small bit of effort each day and some skill of observation. The true test is to pick the true winner. And to ride that winner long enough and with big enough commitment. It is not easy no matter how easy the machinery makes you think it is. It is simple, but hard. Just recognize that simple does not mean easy.

 Spanish
  English