Anyone who has been paying any attention to the stock market will realize that it has been logging new highs. In my view, the move really began in November 2023, so we are just four months into an uptrend.
In all probability, most have already seen the quick ten-week run without any reaction or pullback that stocks like NVDA (Nvidia) and SMCI (Super Micro Computer) seem to have made. Those are the headline-grabbing stocks because everyone knows how they have been acting.
Call it what you want: breakout stocks, stocks making new highs, rocket stocks, action stocks, trending stocks, up-trending stocks—no matter the label, it is plain to see many stocks making higher highs and higher lows.
However, not every stock offers a practical and actionable opportunity. Nonetheless, somewhere buried amongst the slew of new 52-week highs, there are a few gems waiting to be unearthed, and I am going to give you my analysis and insights in this Q1 2024 stock market outlook.
Key Stocks Making Moves in Early 2024
NVDA (Nvidia) made a move from October 2022 to October 2023 that really did not fetch a return. The entire run was impressive, but to be candid, it was untradeable. Yes, it moved up in price, but if you had played the game the right way, you would not have been able to hold it beyond the sell-stop it triggered in October 2023.
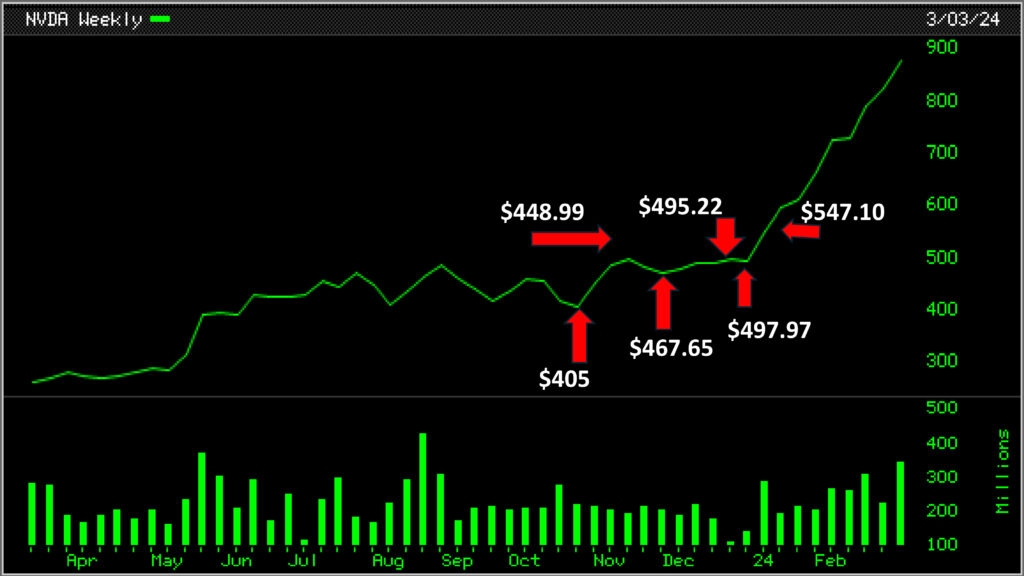
In real-time, that was the right decision. In hindsight, you realize that it was a shake-out, and when you are shaken out, your re-entry is usually aggressive. So, where was the re-entry?
- The first test buy would be at $448.99, the new high after the prior shakeout, with a stop just below $405, the prior low.
- This would be immediately followed by a second buy at $495.22, and now the stop moves up to a little below $467.65.
It is the next entry that demands some conviction and aggressiveness.
Suppose instead of an aggressive buy, the entry was still small, and now suddenly, the current price has run up for 10 weeks straight from $547 to almost $900. What does that mean when a reaction comes along? It all depends on what the stock’s counter move is.
However, if the reaction is large, then what? One can only act on what actually happens. This means you wait, which is how the vast amount of time in the stock market is spent anyway. Waiting.
A Closer Look at SMCI
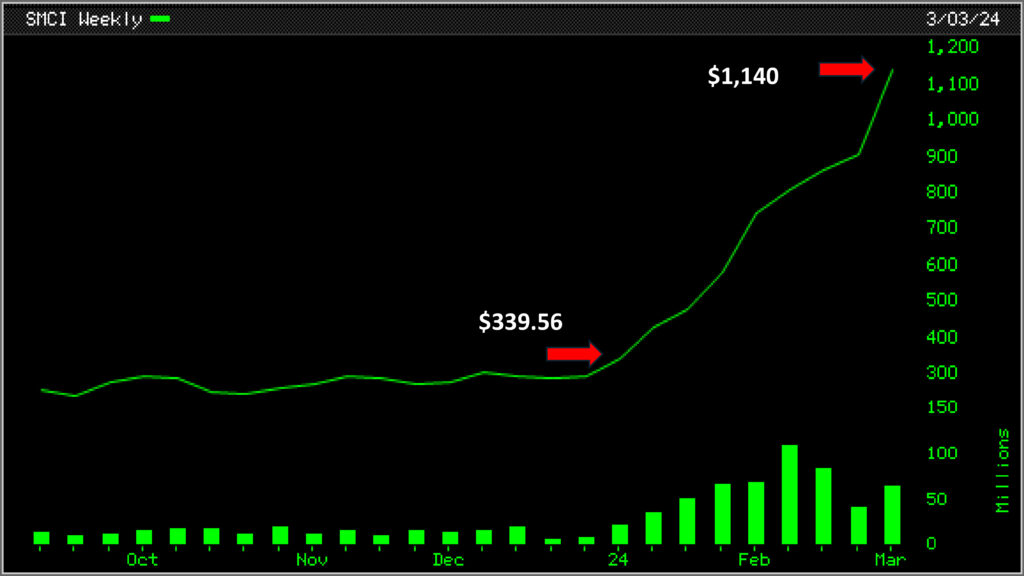
As impressive as Nvidia’s run the past 10 weeks has been, slightly below the radar, Super Micro Computer (SMCI) has made an even more impressive run-up.
In 10 weeks, it ran from $339 to $1,140 a share. It has been one straight-line move up without a reaction or a countermove. Figuring out what the stock has in store is hard because it is offering no clues or countermoves. Once again, a waiting game is where we are at. SMCI is the car right now. Waiting to make a countermove and pounce when least expected.
SMCI chart has been included just for a visual look at this incredible move.
More Stocks to Watch in 2024
While so many eyes are on Nvidia (NVDA) and perhaps a few on SMCI, how many are paying attention to stocks that are less well-known? Are any of these lesser-known stocks on your watchlist? I will list a few of them that should be on your watchlist if they are not already.
As of today’s writing, in mid-March 2024, these stocks are on my watchlist. Are they on yours? Why? Or why not?
These are listed in descending order of average volume of trade.
- ARDX (Ardelyx)
- SMMT (Summit Therapeutics)
- CCCC (C4 Therapeutics)
- SVRA (Savara)
- EYPT (Eyepoint Pharmaceuticals)
- NKTX (Nkarta), CRBP (Corbus Pharmaceuticals)
- PYXS (Pyxis Oncology), SLNO (Soleno Therapeutics)
- STTX (Shattuck Labs), LBPH (Longboard Pharmaceuticals)
- PHVS (Pharvaris NV), SERA (Sera Prognostics)
Given a choice, a stock that trades more volume is preferred over the one that does not. Here is a question. Without looking it up, can you guess which industry most of these stocks belong to?
Most of them are Biotech/Pharma stocks—just looking at their names clues you in. What does that mean? Is the next run going to be in Biotech and Pharma stocks when the entire world is looking at AI stocks? What do you think?
An In-depth Analysis of ARDX
Now, let us look at ARDX. At this point, I am observing, and then I will interpret my observation.
You are probably asking what to observe and how to observe it. Well, my system works for me because it keeps my human weaknesses in check.
To observe what is happening, there is no better method than a stock’s price-volume chart. Here is a chart of the most recent six-month weekly chart of ARDX (Ardelyx).
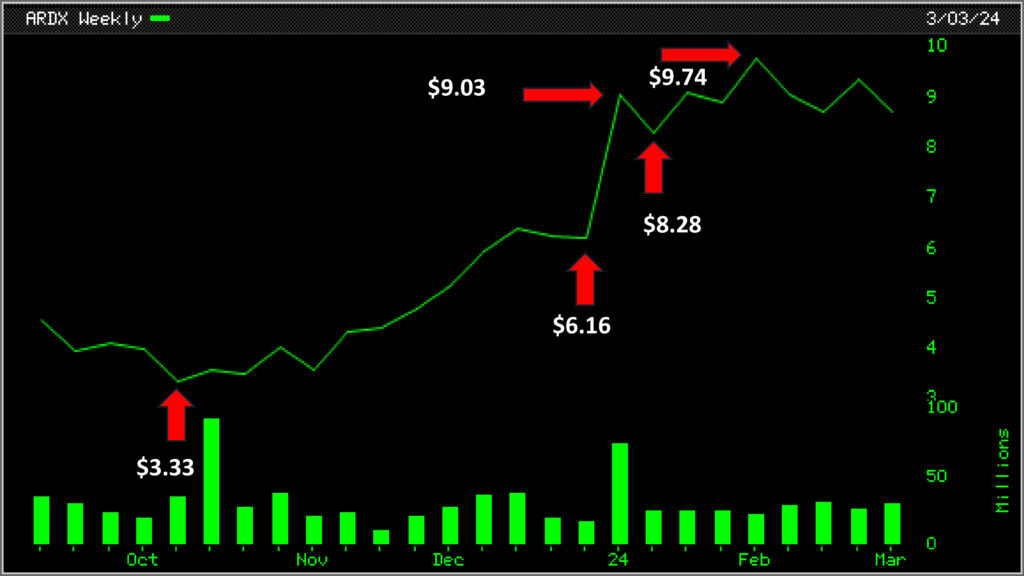
For our purposes, I am just observing the action of ARDX from October 2023 low of $3.33 to date since I already concluded that the recent market uptrend began in November 2023.
While the move from the recent low of $3.33 to the recent high of $9.74, nearly tripling its price, seems impressive, the real move may or may not have truly begun.
So, how do you determine if a true move has begun? There is no way to predict. You have to act on it in real time.
The latest high of $9.74 and the latest low of $8.28 are the rough high-low band for the moment, in real-time as of today. Allowing for a shake-out, let us say that ARDX (Ardelyx) seems to be consolidating between $7 to around $10 a share. Here is what you should do:
You observe its price and volume action moving forward and execute your actions based on the first and foremost rule of all rules, “First Do No Harm.”
If you are going to test the waters, always test it with your toes, not with your entire body. A small test or an experimental buy at new highs, with a self-protecting stop loss a bit below the prior low is the first step.
However, if you are already positioned in ARDX (Ardelyx), entering at its prior highs of around $5.23, then you clearly have a better feel for the ARDX (Ardelyx). The true test is during reaction lows. So, once again, you wait and see.
Thereafter, it is a game of cat and mouse. The funny thing is sometimes you are the cat, and the stock is the mouse, and at other times the stock is the cat, and you are the mouse. Irrespective of that, the steps are the same. You make a move and then wait for the stock to react or make a countermove. Based on the stock’s countermove, you make your next move.
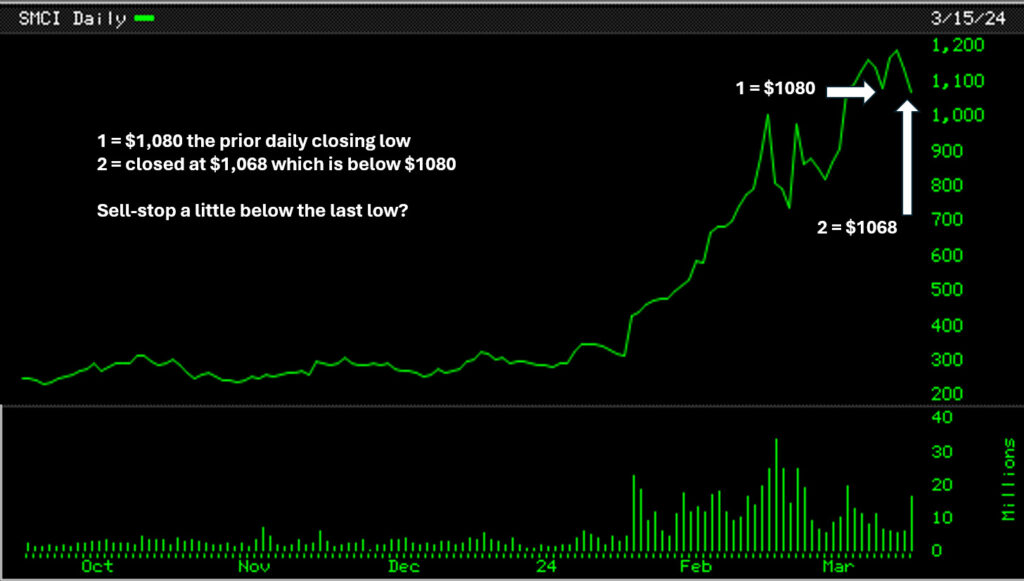
Circling back to NVDA (Nvidia) and SMCI (Super Micro Computer Inc.), that steep almost straight incline up could cause some nervousness because we all know that what goes up must come down. Sir Isaac Newton observed and interpreted that a long time ago. How to tackle the decision as to where to sell NVDA and SMCI? Weekly charts do not offer clues. Will daily charts? Let us take a look.
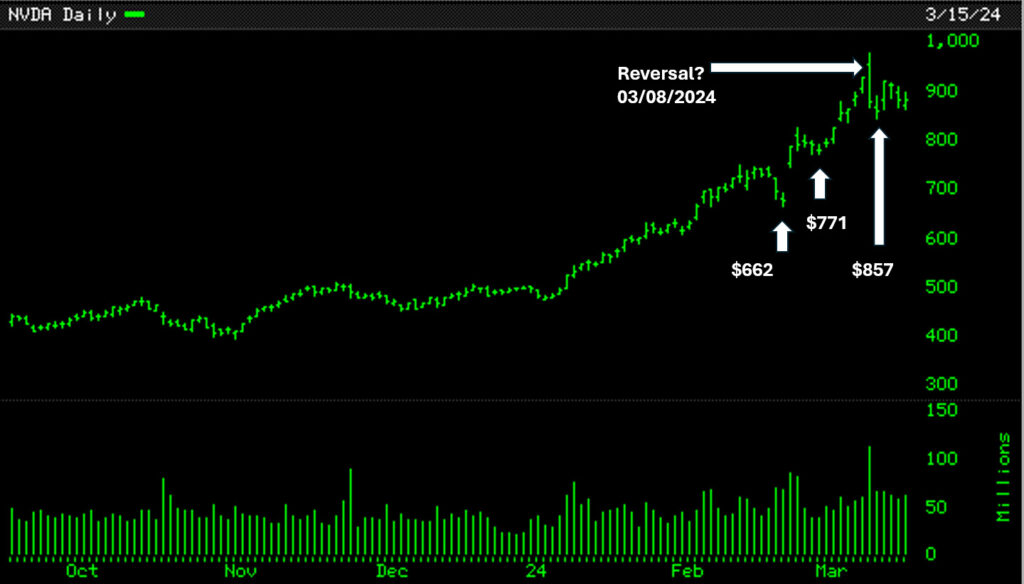
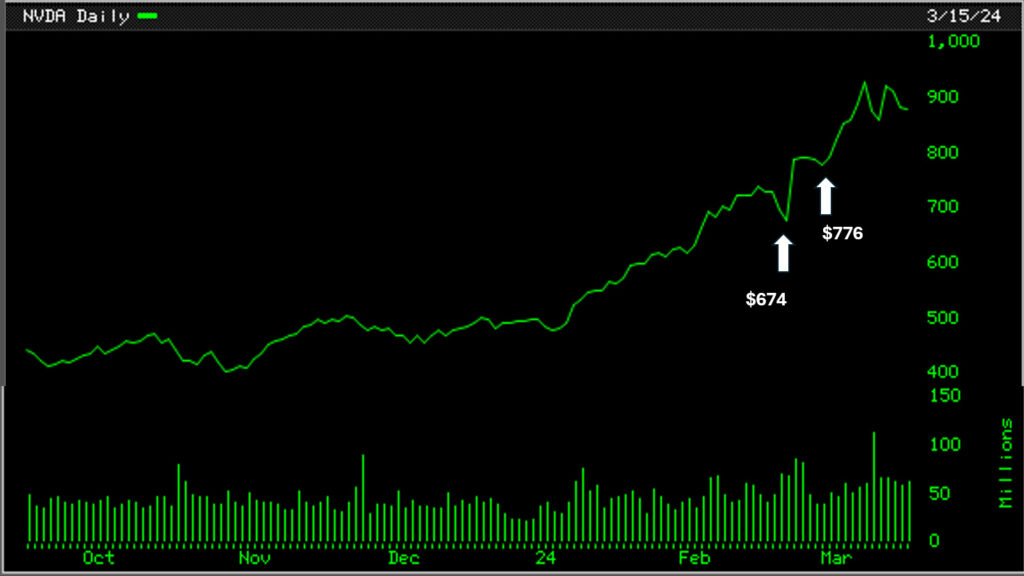
I am looking at both the daily bar chart as well as the daily line chart for NVDA. Are you able to pin-point a sell-stop on the rising trend of NVDA? Is there anything conclusive for you to observe? You be the judge since a picture is worth a thousand words. And how about SMCI? Here is its daily closing chart. Can you call the shot?