The Charts Say…
April 6, 2025
What happened last week was not so sudden. The charts offered clues as far back as December 2024. Not just the indexes, but also many strong performers of 2024 hit their stops. CVNA and PLTR and others come to mind. But since everyone knows about NVDA, let us just see what the charts of NVDA indicate.
Nvidia (NVDA) And Its Trend
Below are some charts of Nvidia. To illustrate how simple charts can be, we will just use monthly and weekly line charts. We can go step by step, one chart at a time. These are simple line charts and they prove there is no need to do any technical studies. All one needs to know is to follow the trend for as long as the trend is in effect.
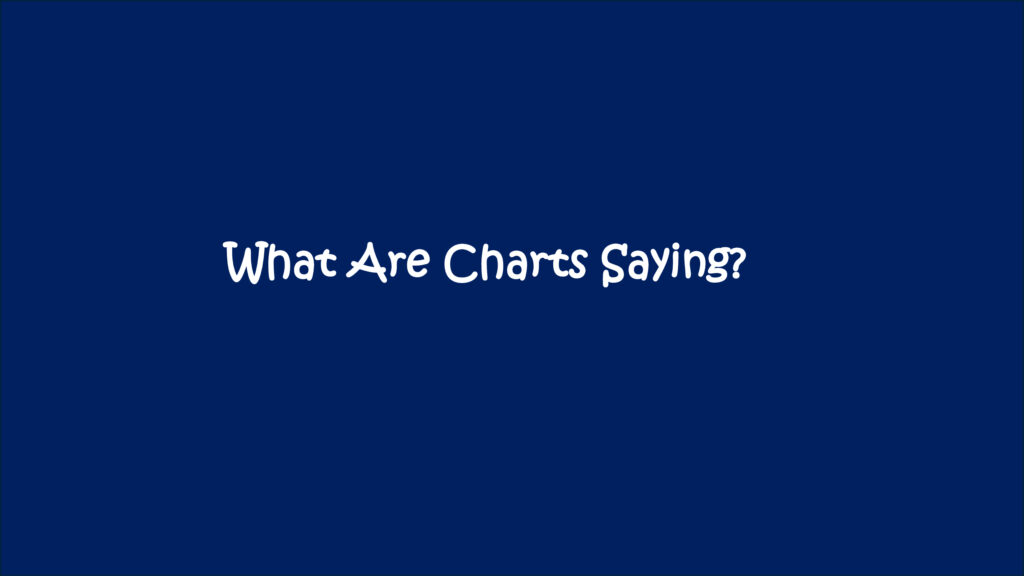
Phase 1 – the uptrend
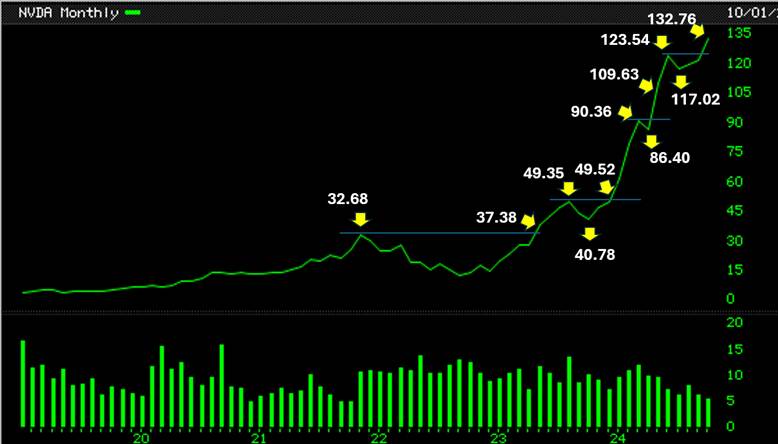
This below is a chart of Nvidia (NVDA). At the simplest level, it is clear to see that the November 2021 high of $32.38 was cleared when a new high in May 2023 at $37.38 was pegged. This was the first signal that an uptrend may have started. That is the observation and the interpretation part. To act upon this would require a closer look at the weekly charts.
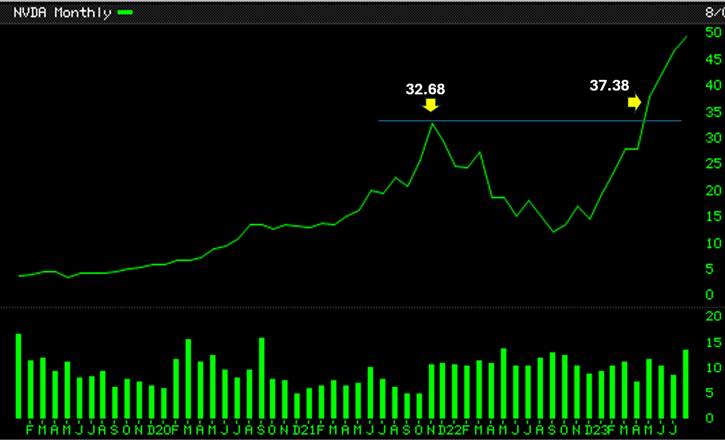
A few weeks later, as time passed, the chart below in conjunction with weekly charts would have offered the first entry for the speculator.
The high at $49.52 is higher than the high at $49.35. And the high at $38.38 is higher than the high at $32.68. And clearly there has been at least one set of higher lows. The uptrend is, by now, pretty obvious.
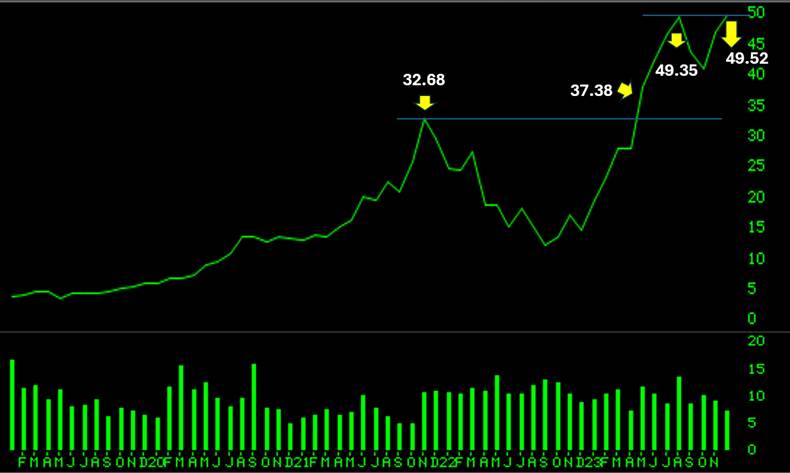
As more time passes, and the weeks and months go by, the chart below confirms the uptrend is in effect.
By the time October 2024 comes along, the chart now looks as shown below.
Phase 2 – the change of trend?
It was not until March 2025 that the end of the uptrend was confirmed on the monthly charts of Nvidia (NVDA). See below.
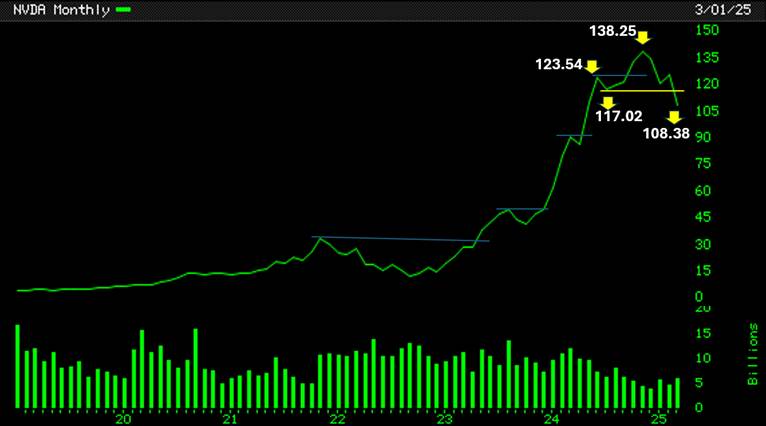
But what if we looked at its weekly charts instead of monthly charts?
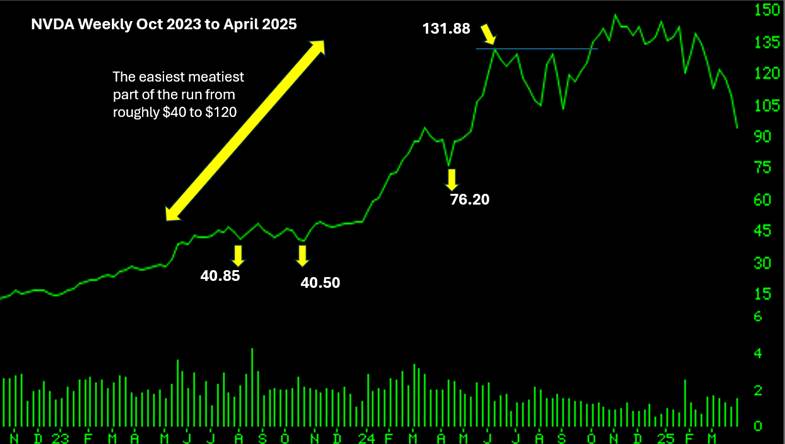
It seems pretty clear that the easiest and the juiciest part of the entire move to capture was somewhere from around the $40 price to about the $120 price. It was during this phase that making money was easy, possible, doable and realistic. The rest of the move is fraught with all kinds of risks and uncertainties and would have been really hard to capture.
If you pay attention to the topping out process and look at the chart below, what do you see?
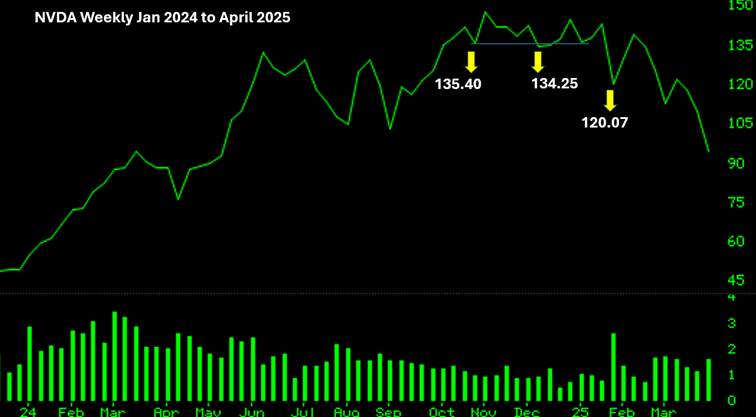
Phase 3 – the waiting game
Waiting is hard. Both when one is in a position as well as when one is in cash.
This is was just an example using Nvidia (NVDA). The video below may offer additional clues.